Title: Range Circles on XYScatterPlot · Issue #457 · core-plot/core-plot · GitHub
Open Graph Title: Range Circles on XYScatterPlot · Issue #457 · core-plot/core-plot
X Title: Range Circles on XYScatterPlot · Issue #457 · core-plot/core-plot
Description: While I'm in the midst of working out the fundamentals of core-plot and possibly adding functionality, I was wondering if there might be a method for exposing some drawing primitives, such as drawing a circle, as an axis grid lines optio...
Open Graph Description: While I'm in the midst of working out the fundamentals of core-plot and possibly adding functionality, I was wondering if there might be a method for exposing some drawing primitives, such as drawi...
X Description: While I'm in the midst of working out the fundamentals of core-plot and possibly adding functionality, I was wondering if there might be a method for exposing some drawing primitives, such as d...
Opengraph URL: https://github.com/core-plot/core-plot/issues/457
X: @github
Domain: patch-diff.githubusercontent.com
{"@context":"https://schema.org","@type":"DiscussionForumPosting","headline":"Range Circles on XYScatterPlot","articleBody":"While I'm in the midst of working out the fundamentals of core-plot and possibly adding functionality, I was wondering if there might be a method for exposing some drawing primitives, such as drawing a circle, as an axis grid lines option?\r\n\r\nI have a plot that works in X-Y space, in this case it's the components of a 2D vector. As such, a circular ring represents the magnitude of that vector. I've managed to implement this in a very naive way by calculating the points of a circle and plotting it manually, as seen in this image below. \r\n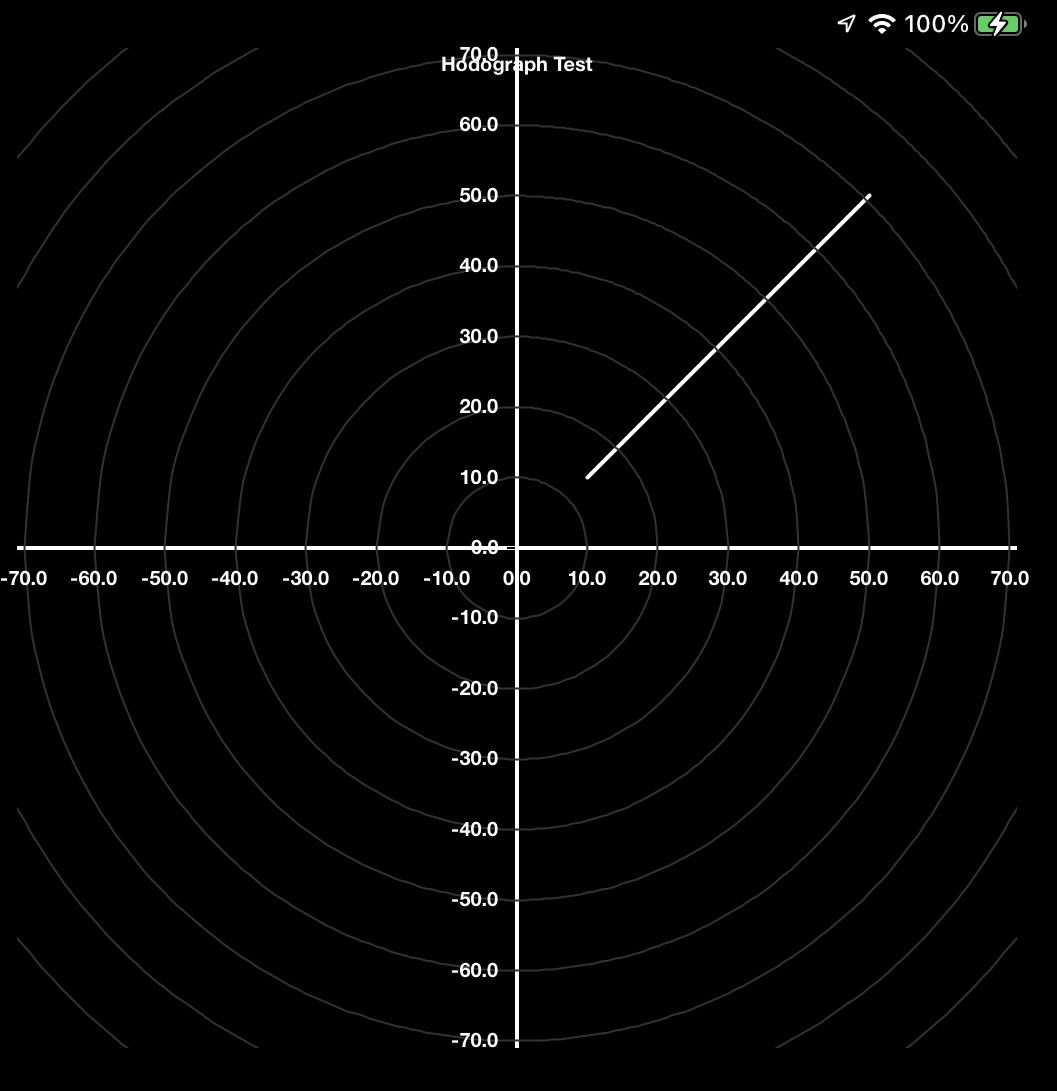\r\n\r\nUnfortunately, either due to issues of numerical accuracy, or the curved/linear interpolation for lines, my circles are actually kind of squiggly. The other down side, is that to get more accurate circles, you have to compute more and more points, which eventually causes performance issues when using pan/zoom interactivity. \r\n\r\nPreviously when working with OpenGL, I was able to call specific drawing primitives for defining a circle, and it was much more efficient performance wise while also not having to deal with squiggles/calculating points. Obviously CPTXYAxis will need to be modified to pull anything like this off, but are there any tips or starting points that use circle drawing primitives? Or is this a bit of a pipe dream?\r\n\r\n```\r\n func addIsotachLines(){\r\n print(\"Called!\")\r\n for spd in self.windSpeedValues {\r\n // just a quarter circle right now\r\n for u in stride(from: spd, to: 0.0, by: -0.5) {\r\n self.isotachLines_u.append(Double(u))\r\n self.isotachLines_v.append( sqrt(pow(Double(spd), 2.0) - pow(Double(u), 2.0)) )\r\n }\r\n for u in stride(from: 1.0, to: spd+1.0, by: 1.0) {\r\n self.isotachLines_u.append(-1.0 * Double(u))\r\n self.isotachLines_v.append( sqrt(pow(Double(spd), 2.0) - pow(Double(u), 2.0)) )\r\n }\r\n for u in stride(from: -1.0*spd, to:0.0, by: 1.0) {\r\n self.isotachLines_u.append(Double(u))\r\n self.isotachLines_v.append( -1.0*sqrt(pow(Double(spd), 2.0) - pow(Double(u), 2.0)) )\r\n }\r\n for u in stride(from: 0.0, to: spd+1.0, by: 1.0) {\r\n self.isotachLines_u.append(Double(u))\r\n self.isotachLines_v.append( -1.0*sqrt(pow(Double(spd), 2.0) - pow(Double(u), 2.0)) )\r\n }\r\n self.isotachLines_u.append(nil)\r\n self.isotachLines_v.append(nil)\r\n }\r\n\r\n plot = CPTScatterPlot()\r\n let color = CPTColor(componentRed: CGFloat(50.0/255.0), green: CGFloat(50/255.0), blue: CGFloat(50.0/255.0), alpha: CGFloat(1))\r\n let plotLineStyle = CPTMutableLineStyle()\r\n plotLineStyle.lineJoin = .round\r\n plotLineStyle.lineCap = .round\r\n plotLineStyle.lineWidth = 1\r\n plotLineStyle.lineColor = color\r\n plot.dataLineStyle = plotLineStyle\r\n plot.curvedInterpolationOption = .catmullCustomAlpha\r\n plot.interpolation = .curved\r\n plot.identifier = \"isotachs-hodo\" as NSCoding \u0026 NSCopying \u0026 NSObjectProtocol\r\n guard let graph = hodoChart.hostedGraph else { return }\r\n plot.dataSource = (self as CPTPlotDataSource)\r\n plot.delegate = (self as CALayerDelegate)\r\n graph.add(plot, to: graph.defaultPlotSpace)\r\n }\r\n```\r\n ","author":{"url":"https://github.com/keltonhalbert","@type":"Person","name":"keltonhalbert"},"datePublished":"2021-10-12T23:51:09.000Z","interactionStatistic":{"@type":"InteractionCounter","interactionType":"https://schema.org/CommentAction","userInteractionCount":1},"url":"https://github.com/457/core-plot/issues/457"}| route-pattern | /_view_fragments/issues/show/:user_id/:repository/:id/issue_layout(.:format) |
| route-controller | voltron_issues_fragments |
| route-action | issue_layout |
| fetch-nonce | v2:6ee5540a-2758-98f0-8801-82d85fc67a64 |
| current-catalog-service-hash | 81bb79d38c15960b92d99bca9288a9108c7a47b18f2423d0f6438c5b7bcd2114 |
| request-id | CE0A:56F18:1521CCE:1AD7750:6975B512 |
| html-safe-nonce | f92afe3d905ea8309015b6e7abe3dd0bac2751b0386dffad75d62b7d7edb5670 |
| visitor-payload | eyJyZWZlcnJlciI6IiIsInJlcXVlc3RfaWQiOiJDRTBBOjU2RjE4OjE1MjFDQ0U6MUFENzc1MDo2OTc1QjUxMiIsInZpc2l0b3JfaWQiOiI2MzA0Mzc1NTA4MjA4ODI1NjE4IiwicmVnaW9uX2VkZ2UiOiJpYWQiLCJyZWdpb25fcmVuZGVyIjoiaWFkIn0= |
| visitor-hmac | a8044fa0bc5a03db6916198ac4efe77bfff97b0ce7b582562d5279717d3978a0 |
| hovercard-subject-tag | issue:1024608387 |
| github-keyboard-shortcuts | repository,issues,copilot |
| google-site-verification | Apib7-x98H0j5cPqHWwSMm6dNU4GmODRoqxLiDzdx9I |
| octolytics-url | https://collector.github.com/github/collect |
| analytics-location | / |
| fb:app_id | 1401488693436528 |
| apple-itunes-app | app-id=1477376905, app-argument=https://github.com/_view_fragments/issues/show/core-plot/core-plot/457/issue_layout |
| twitter:image | https://opengraph.githubassets.com/74e4cc973a64c3796a69089a9ab60ed950a1fa942a6181d463ebfc0ee8c59efc/core-plot/core-plot/issues/457 |
| twitter:card | summary_large_image |
| og:image | https://opengraph.githubassets.com/74e4cc973a64c3796a69089a9ab60ed950a1fa942a6181d463ebfc0ee8c59efc/core-plot/core-plot/issues/457 |
| og:image:alt | While I'm in the midst of working out the fundamentals of core-plot and possibly adding functionality, I was wondering if there might be a method for exposing some drawing primitives, such as drawi... |
| og:image:width | 1200 |
| og:image:height | 600 |
| og:site_name | GitHub |
| og:type | object |
| og:author:username | keltonhalbert |
| hostname | github.com |
| expected-hostname | github.com |
| None | 4a4bf5f4e28041a9d2e5c107d7d20b78b4294ba261cab243b28167c16a623a1f |
| turbo-cache-control | no-preview |
| go-import | github.com/core-plot/core-plot git https://github.com/core-plot/core-plot.git |
| octolytics-dimension-user_id | 6242309 |
| octolytics-dimension-user_login | core-plot |
| octolytics-dimension-repository_id | 15383182 |
| octolytics-dimension-repository_nwo | core-plot/core-plot |
| octolytics-dimension-repository_public | true |
| octolytics-dimension-repository_is_fork | false |
| octolytics-dimension-repository_network_root_id | 15383182 |
| octolytics-dimension-repository_network_root_nwo | core-plot/core-plot |
| turbo-body-classes | logged-out env-production page-responsive |
| disable-turbo | false |
| browser-stats-url | https://api.github.com/_private/browser/stats |
| browser-errors-url | https://api.github.com/_private/browser/errors |
| release | 488b30e96dfd057fbbe44c6665ccbc030b729dde |
| ui-target | full |
| theme-color | #1e2327 |
| color-scheme | light dark |
Links:
Viewport: width=device-width