Title: Angled/Skewed Axis · Issue #454 · core-plot/core-plot · GitHub
Open Graph Title: Angled/Skewed Axis · Issue #454 · core-plot/core-plot
X Title: Angled/Skewed Axis · Issue #454 · core-plot/core-plot
Description: Hello, I'd like to inquire about and offer to help add a feature I'd like to be able to use but I'm not quite sure where to start with implementing it. There's a scientific chart I'd like to make called a Skew-T Log-P diagram. The Y axis...
Open Graph Description: Hello, I'd like to inquire about and offer to help add a feature I'd like to be able to use but I'm not quite sure where to start with implementing it. There's a scientific chart I'd like to make c...
X Description: Hello, I'd like to inquire about and offer to help add a feature I'd like to be able to use but I'm not quite sure where to start with implementing it. There's a scientific chart I&...
Opengraph URL: https://github.com/core-plot/core-plot/issues/454
X: @github
Domain: patch-diff.githubusercontent.com
{"@context":"https://schema.org","@type":"DiscussionForumPosting","headline":"Angled/Skewed Axis","articleBody":"Hello,\r\n\r\nI'd like to inquire about and offer to help add a feature I'd like to be able to use but I'm not quite sure where to start with implementing it. There's a scientific chart I'd like to make called a Skew-T Log-P diagram. The Y axis (Pressure as a vertical coordinate) is in logarithmic space, which thankfully core-plot already does! The strange part is that the X-axis is skewed (Temperature) anywhere from 33-45 degrees to the right of the vertical axis. I noticed that there is a not-yet implemented ScaleType identifier called 'angular', which sounds like it would be a good direction for being able to implement such a transformation. Here's an example plot below. The solid red line highlighted as the freezing level is an example of how a constant X axis value is represented by a slanted line. \r\n\r\n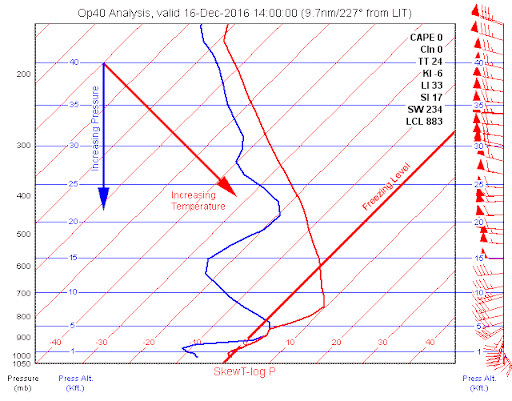\r\n\r\nThe Charts library for iOS has the ability to apply a matrix transform in which the underlying data can be skewed, but there's nothing for the axis lines. Awkwardly, Charts also doesn't support logarithmic data spaces easily. I would also prefer to use core-plot since it leverages the GPU more than Charts. I'd also prefer to be able to keep things in data-space coordinates and implement this at a lower level. \r\n\r\nI've implemented this a little more directly before using Qt Widgets using the following functions to transform from data space to pixel space. I understand that implementing this would be required at a lower level than what's done in Qt here, but if I can be directed to a good starting place I think I could figure out the rest and make a pull request. \r\n\r\nAny suggestions on where to start?\r\n\r\n\r\n```\r\ndef initUI(self):\r\n ## These are some padding variables for axis drawing, and data-space limits on the graph\r\n self.lpad = 30; self.rpad = 65\r\n self.tpad = 20; self.bpad = 20\r\n self.tlx = self.rpad; self.tly = self.tpad\r\n self.wid = self.size().width() - self.rpad\r\n self.hgt = self.size().height() - self.bpad\r\n self.brx = self.wid ; self.bry = self.hgt\r\n self.pmax = 1050.; self.pmin = 100.\r\n self.barbx = self.brx + self.rpad / 2\r\n self.log_pmax = np.log(self.pmax); self.log_pmin = np.log(self.pmin)\r\n self.bltmpc = -50; self.brtmpc = 50; self.dt = 10\r\n self.xskew = 100 / 3.\r\n self.xrange = self.brtmpc - self.bltmpc\r\n self.yrange = np.tan(np.deg2rad(self.xskew)) * self.xrange\r\n self.clip = QRect(QPoint(self.lpad, self.tly), QPoint(self.brx + self.rpad, self.bry))\r\n self.originx = 0. # self.size().width() / 2\r\n self.originy = 0. # self.size().height() / 2\r\n self.scale = 1.\r\n```\r\n\r\n```\r\n def pres_to_pix(self, p):\r\n scl1 = self.log_pmax - self.log_pmin\r\n scl2 = self.log_pmax - np.log(p)\r\n return self.bry - (scl2 / scl1) * (self.bry - self.tpad)\r\n\r\n def tmpc_to_pix(self, t, p):\r\n scl1 = self.brtmpc - (((self.bry - self.pres_to_pix(p)) /\r\n (self.bry - self.tpad)) * self.yrange)\r\n return self.brx - (((scl1 - t) / self.xrange) * (self.brx - self.lpad))\r\n```\r\n\r\n\r\n\r\n\r\n","author":{"url":"https://github.com/keltonhalbert","@type":"Person","name":"keltonhalbert"},"datePublished":"2021-10-01T03:48:12.000Z","interactionStatistic":{"@type":"InteractionCounter","interactionType":"https://schema.org/CommentAction","userInteractionCount":11},"url":"https://github.com/454/core-plot/issues/454"}| route-pattern | /_view_fragments/issues/show/:user_id/:repository/:id/issue_layout(.:format) |
| route-controller | voltron_issues_fragments |
| route-action | issue_layout |
| fetch-nonce | v2:28e263ad-d78e-83c5-e9f0-de2052b7128b |
| current-catalog-service-hash | 81bb79d38c15960b92d99bca9288a9108c7a47b18f2423d0f6438c5b7bcd2114 |
| request-id | CC60:E7822:D58AFD4:114554C3:69770232 |
| html-safe-nonce | 779e59a9fc18839e1c568a755a6c2218e9ec588ed9f1ad655e2cb76057e6a7a8 |
| visitor-payload | eyJyZWZlcnJlciI6IiIsInJlcXVlc3RfaWQiOiJDQzYwOkU3ODIyOkQ1OEFGRDQ6MTE0NTU0QzM6Njk3NzAyMzIiLCJ2aXNpdG9yX2lkIjoiMTM4NzY2OTk2NjIxMDY2Mjk2MiIsInJlZ2lvbl9lZGdlIjoiaWFkIiwicmVnaW9uX3JlbmRlciI6ImlhZCJ9 |
| visitor-hmac | 5061bbb590edd569b20133420c6dbce45e88eb46601c1a48ac41362bd2d898c5 |
| hovercard-subject-tag | issue:1012851056 |
| github-keyboard-shortcuts | repository,issues,copilot |
| google-site-verification | Apib7-x98H0j5cPqHWwSMm6dNU4GmODRoqxLiDzdx9I |
| octolytics-url | https://collector.github.com/github/collect |
| analytics-location | / |
| fb:app_id | 1401488693436528 |
| apple-itunes-app | app-id=1477376905, app-argument=https://github.com/_view_fragments/issues/show/core-plot/core-plot/454/issue_layout |
| twitter:image | https://opengraph.githubassets.com/058a6e6dbc936c17115e754d096c0f96d0d57157f036044575f5ce8384187ba2/core-plot/core-plot/issues/454 |
| twitter:card | summary_large_image |
| og:image | https://opengraph.githubassets.com/058a6e6dbc936c17115e754d096c0f96d0d57157f036044575f5ce8384187ba2/core-plot/core-plot/issues/454 |
| og:image:alt | Hello, I'd like to inquire about and offer to help add a feature I'd like to be able to use but I'm not quite sure where to start with implementing it. There's a scientific chart I'd like to make c... |
| og:image:width | 1200 |
| og:image:height | 600 |
| og:site_name | GitHub |
| og:type | object |
| og:author:username | keltonhalbert |
| hostname | github.com |
| expected-hostname | github.com |
| None | 01d198479908d09a841b2febe8eb105a81af2af7d81830960fe0971e1f4adc09 |
| turbo-cache-control | no-preview |
| go-import | github.com/core-plot/core-plot git https://github.com/core-plot/core-plot.git |
| octolytics-dimension-user_id | 6242309 |
| octolytics-dimension-user_login | core-plot |
| octolytics-dimension-repository_id | 15383182 |
| octolytics-dimension-repository_nwo | core-plot/core-plot |
| octolytics-dimension-repository_public | true |
| octolytics-dimension-repository_is_fork | false |
| octolytics-dimension-repository_network_root_id | 15383182 |
| octolytics-dimension-repository_network_root_nwo | core-plot/core-plot |
| turbo-body-classes | logged-out env-production page-responsive |
| disable-turbo | false |
| browser-stats-url | https://api.github.com/_private/browser/stats |
| browser-errors-url | https://api.github.com/_private/browser/errors |
| release | f752335dbbea672610081196a1998e39aec5e14b |
| ui-target | full |
| theme-color | #1e2327 |
| color-scheme | light dark |
Links:
Viewport: width=device-width