Title: Discontinuous Nyquist Plot · Issue #691 · python-control/python-control · GitHub
Open Graph Title: Discontinuous Nyquist Plot · Issue #691 · python-control/python-control
X Title: Discontinuous Nyquist Plot · Issue #691 · python-control/python-control
Description: Today I used the following code to produce the nyquist plot of an arbitrary transfer function: import numpy as np from control.matlab import * import matplotlib.pyplot as plt a0 = 1.; a1 = 10.; a2 = 31.; a3 = 30 b0 = 1. num = np.array([b...
Open Graph Description: Today I used the following code to produce the nyquist plot of an arbitrary transfer function: import numpy as np from control.matlab import * import matplotlib.pyplot as plt a0 = 1.; a1 = 10.; a2 ...
X Description: Today I used the following code to produce the nyquist plot of an arbitrary transfer function: import numpy as np from control.matlab import * import matplotlib.pyplot as plt a0 = 1.; a1 = 10.; a2 ...
Opengraph URL: https://github.com/python-control/python-control/issues/691
X: @github
Domain: github.com
{"@context":"https://schema.org","@type":"DiscussionForumPosting","headline":"Discontinuous Nyquist Plot","articleBody":"Today I used the following code to produce the nyquist plot of an arbitrary transfer function:\r\n\r\n```\r\nimport numpy as np\r\nfrom control.matlab import *\r\nimport matplotlib.pyplot as plt\r\n\r\na0 = 1.; a1 = 10.; a2 = 31.; a3 = 30\r\nb0 = 1.\r\nnum = np.array([b0])\r\nden = np.array([a3, a2, a1, a0])\r\nsystem_tf = tf(num,den)\r\nctrl_tf = tf([5, 1],[5, 0])\r\nG0 = ctrl_tf*system_tf\r\nGw = feedback(G0,1)\r\nnyquist(Gw)\r\nplt.show()\r\n\r\n```\r\nand I got this strange discontinuous Nyquist plot:\r\n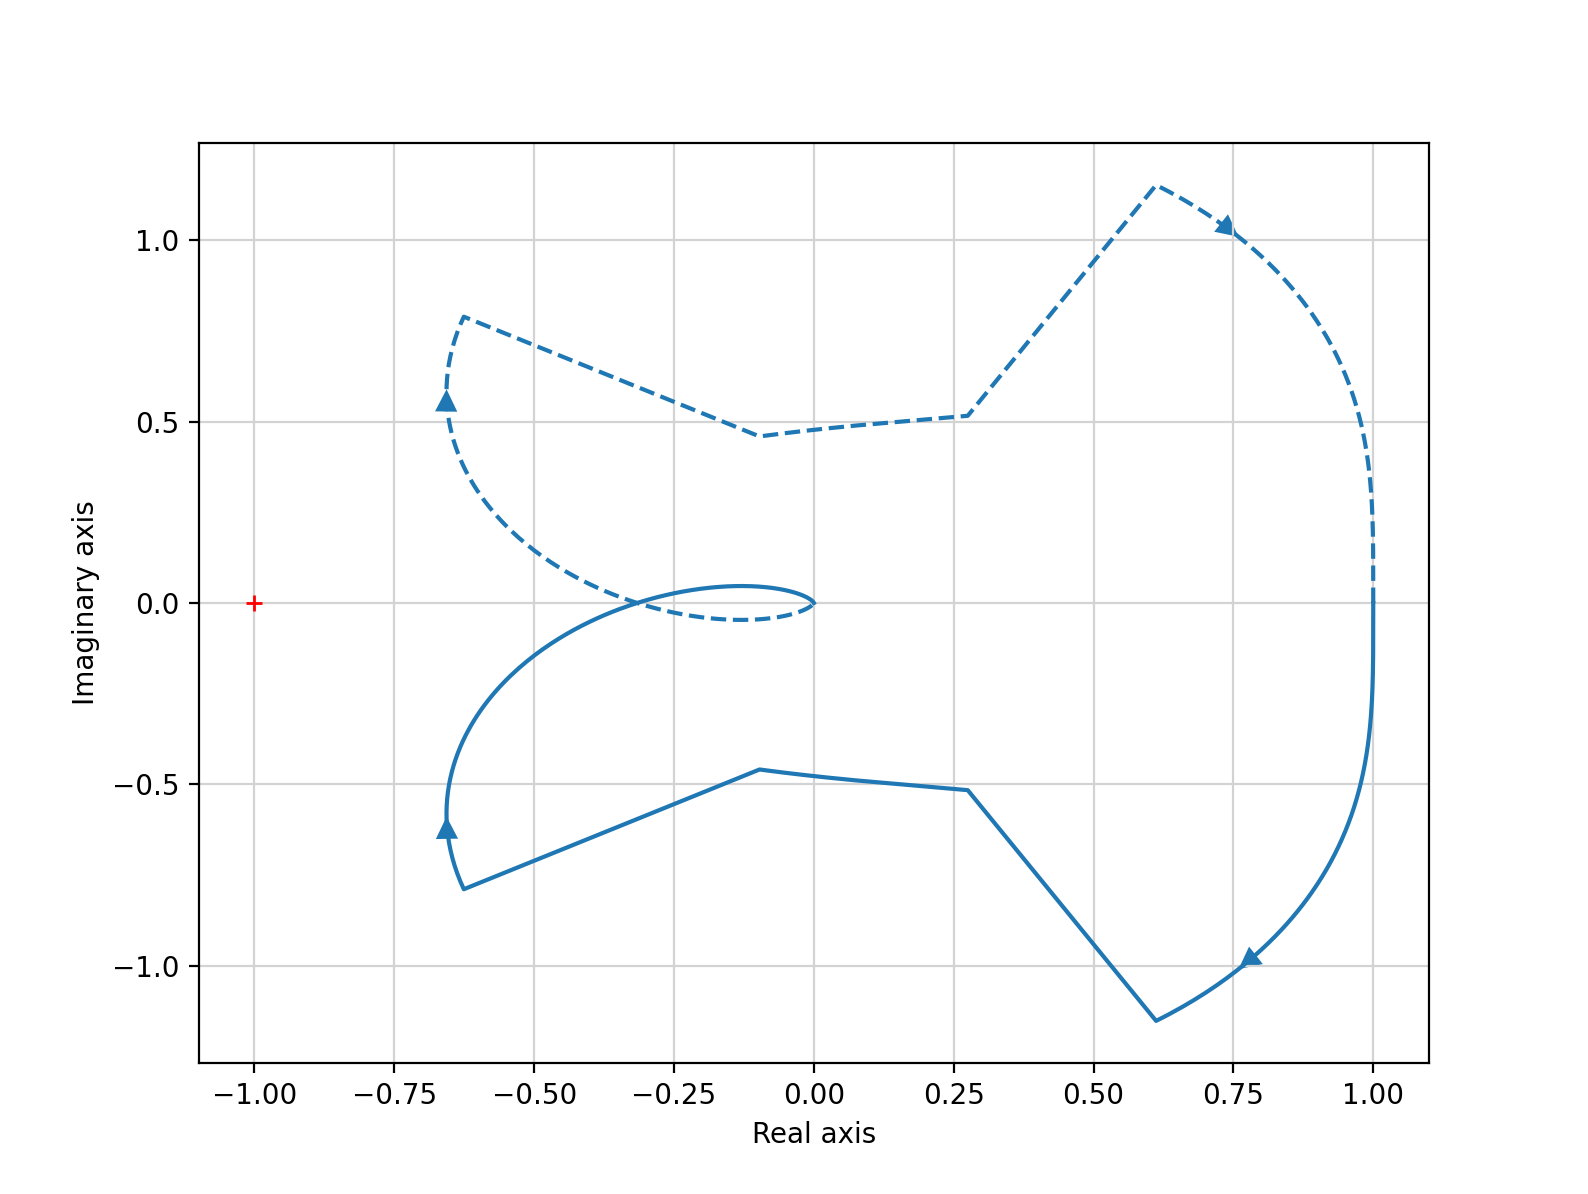\r\n\r\nthe bode plot looks correct and I found that both plots use different functions to evaluate the frequency response. So I think there might be a bug in the implementation of the nyquist plot.\r\n\r\nHere is the expected Nyquist plot that I could obtain from Matlab.\r\n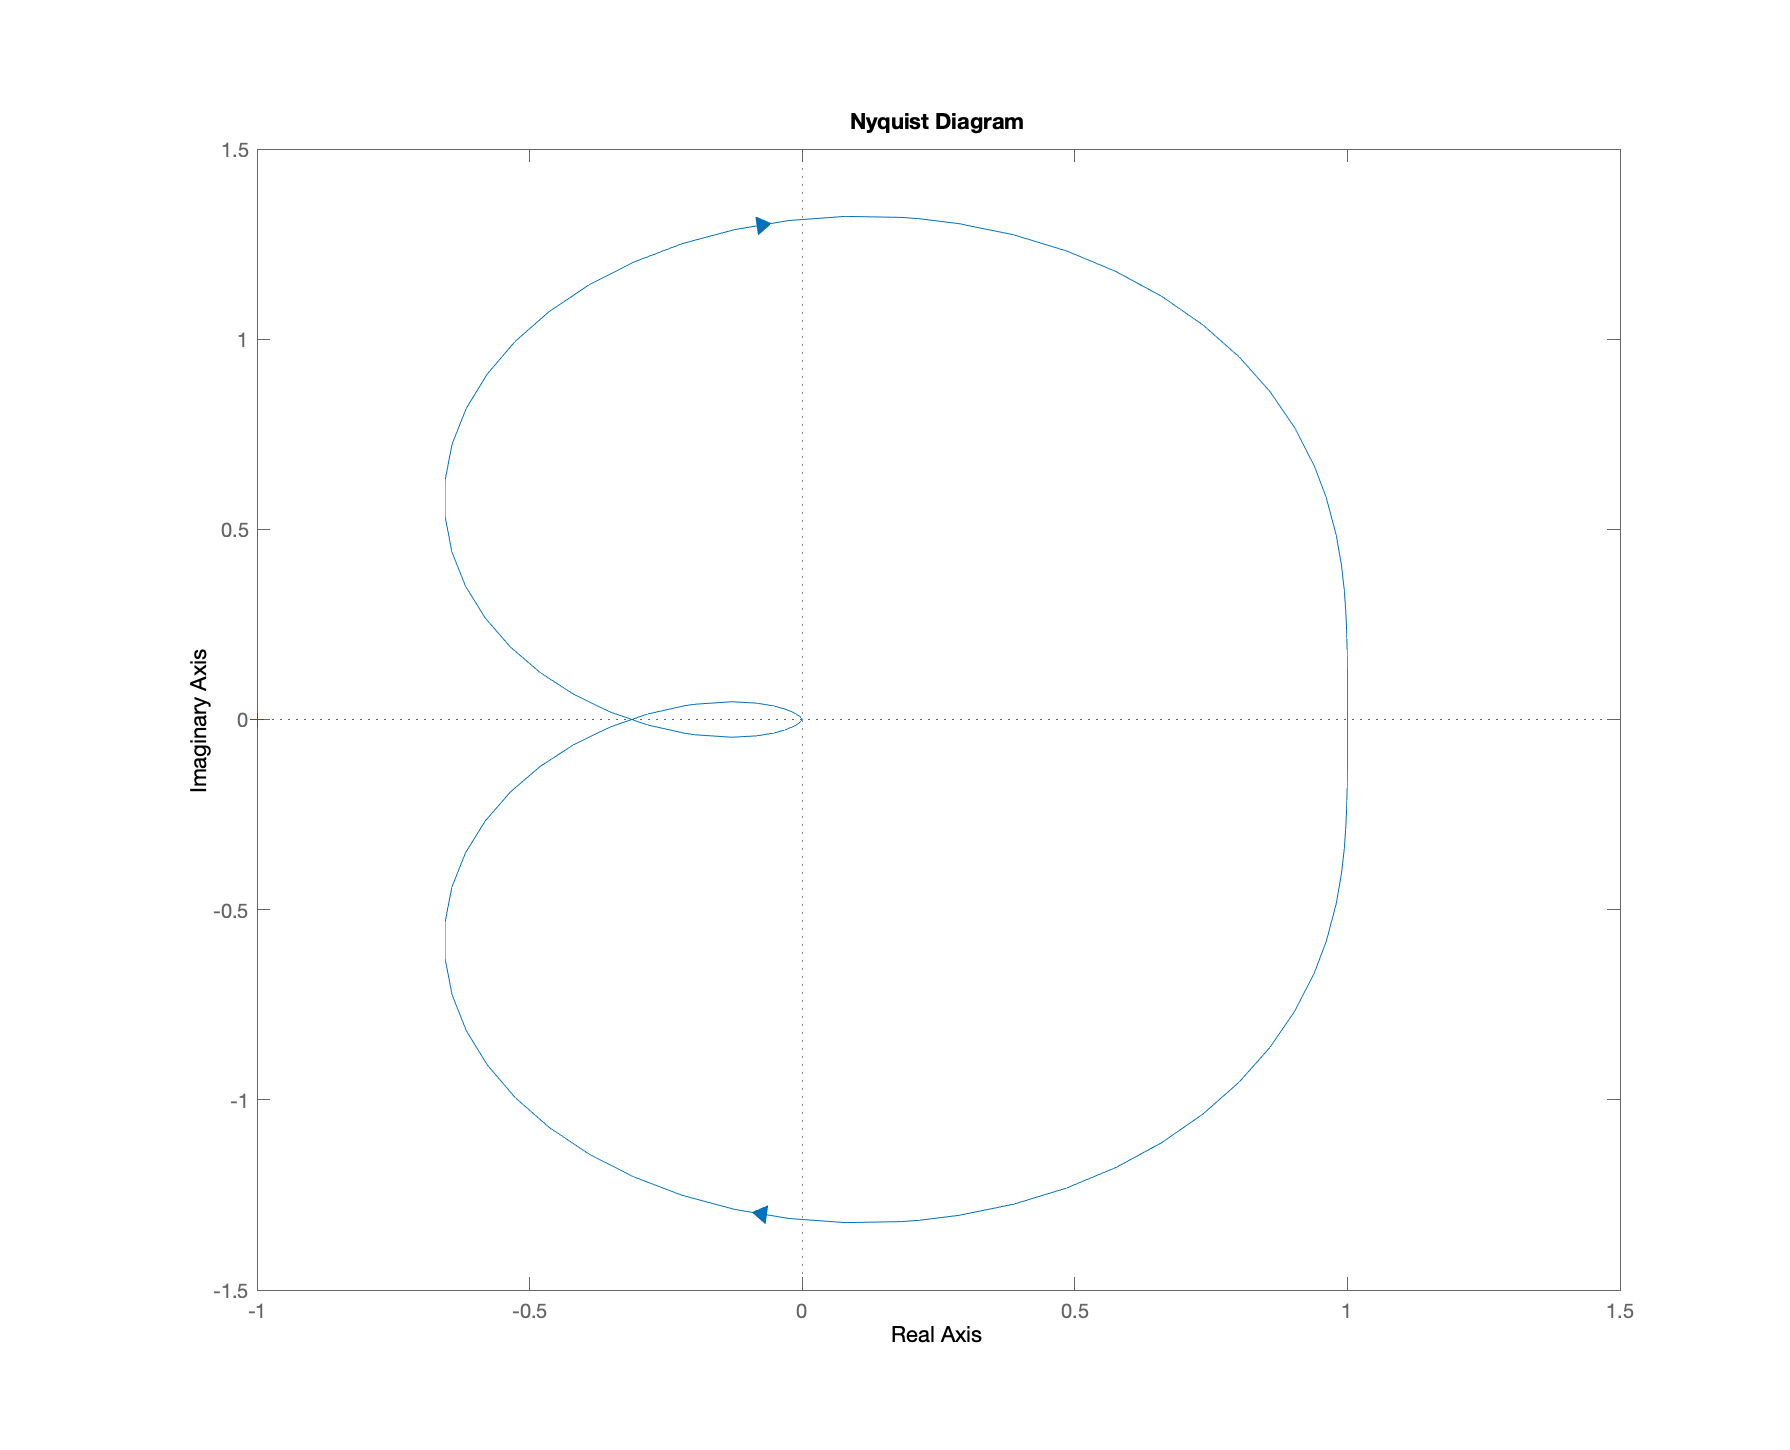\r\n\r\n","author":{"url":"https://github.com/JayEy","@type":"Person","name":"JayEy"},"datePublished":"2022-01-15T12:08:20.000Z","interactionStatistic":{"@type":"InteractionCounter","interactionType":"https://schema.org/CommentAction","userInteractionCount":8},"url":"https://github.com/691/python-control/issues/691"}| route-pattern | /_view_fragments/issues/show/:user_id/:repository/:id/issue_layout(.:format) |
| route-controller | voltron_issues_fragments |
| route-action | issue_layout |
| fetch-nonce | v2:65facfc7-d4e3-188c-a2ca-c46a893e5acd |
| current-catalog-service-hash | 81bb79d38c15960b92d99bca9288a9108c7a47b18f2423d0f6438c5b7bcd2114 |
| request-id | 85CE:DE33:5C2C7E:8271A4:6979ED86 |
| html-safe-nonce | ab815c60474b92b6d1f47afa0c92b073bc638ca57219a38efd0b393c1fc56e16 |
| visitor-payload | eyJyZWZlcnJlciI6IiIsInJlcXVlc3RfaWQiOiI4NUNFOkRFMzM6NUMyQzdFOjgyNzFBNDo2OTc5RUQ4NiIsInZpc2l0b3JfaWQiOiI3NzI3Njg0ODEwNjI0ODU1NDMwIiwicmVnaW9uX2VkZ2UiOiJpYWQiLCJyZWdpb25fcmVuZGVyIjoiaWFkIn0= |
| visitor-hmac | 76b16f4a87f75437db18774b2a37fae6b6faa03fde6cd8704b1ba970adf24d3e |
| hovercard-subject-tag | issue:1104697350 |
| github-keyboard-shortcuts | repository,issues,copilot |
| google-site-verification | Apib7-x98H0j5cPqHWwSMm6dNU4GmODRoqxLiDzdx9I |
| octolytics-url | https://collector.github.com/github/collect |
| analytics-location | / |
| fb:app_id | 1401488693436528 |
| apple-itunes-app | app-id=1477376905, app-argument=https://github.com/_view_fragments/issues/show/python-control/python-control/691/issue_layout |
| twitter:image | https://opengraph.githubassets.com/be4e9428c608ffac9b347577e32d16976a5a148b295fd7fa38904b1cbae15e2f/python-control/python-control/issues/691 |
| twitter:card | summary_large_image |
| og:image | https://opengraph.githubassets.com/be4e9428c608ffac9b347577e32d16976a5a148b295fd7fa38904b1cbae15e2f/python-control/python-control/issues/691 |
| og:image:alt | Today I used the following code to produce the nyquist plot of an arbitrary transfer function: import numpy as np from control.matlab import * import matplotlib.pyplot as plt a0 = 1.; a1 = 10.; a2 ... |
| og:image:width | 1200 |
| og:image:height | 600 |
| og:site_name | GitHub |
| og:type | object |
| og:author:username | JayEy |
| hostname | github.com |
| expected-hostname | github.com |
| None | d518616844426fb176f4177c4776349f6e70ef1ce75f459c8c53bf9293bb6982 |
| turbo-cache-control | no-preview |
| go-import | github.com/python-control/python-control git https://github.com/python-control/python-control.git |
| octolytics-dimension-user_id | 2285872 |
| octolytics-dimension-user_login | python-control |
| octolytics-dimension-repository_id | 22791752 |
| octolytics-dimension-repository_nwo | python-control/python-control |
| octolytics-dimension-repository_public | true |
| octolytics-dimension-repository_is_fork | false |
| octolytics-dimension-repository_network_root_id | 22791752 |
| octolytics-dimension-repository_network_root_nwo | python-control/python-control |
| turbo-body-classes | logged-out env-production page-responsive |
| disable-turbo | false |
| browser-stats-url | https://api.github.com/_private/browser/stats |
| browser-errors-url | https://api.github.com/_private/browser/errors |
| release | 22c6ce7724007ae85d7487fce3308a1c7cea8be6 |
| ui-target | full |
| theme-color | #1e2327 |
| color-scheme | light dark |
Links:
Viewport: width=device-width