Title: Nyquist plot with imaginary poles, semi-circles only working after 'trick' · Issue #613 · python-control/python-control · GitHub
Open Graph Title: Nyquist plot with imaginary poles, semi-circles only working after 'trick' · Issue #613 · python-control/python-control
X Title: Nyquist plot with imaginary poles, semi-circles only working after 'trick' · Issue #613 · python-control/python-control
Description: I'm plotting the Nyquist diagram of a transfer function which has poles on the imaginary axis: import control import matplotlib.pyplot as plt import numpy as np K = 1 Gp = control.tf([1], [1,1,0,0,0]) Gc = control.tf([K], [1]) control.ny...
Open Graph Description: I'm plotting the Nyquist diagram of a transfer function which has poles on the imaginary axis: import control import matplotlib.pyplot as plt import numpy as np K = 1 Gp = control.tf([1], [1,1,0,0,...
X Description: I'm plotting the Nyquist diagram of a transfer function which has poles on the imaginary axis: import control import matplotlib.pyplot as plt import numpy as np K = 1 Gp = control.tf([1], [1,1,...
Opengraph URL: https://github.com/python-control/python-control/issues/613
X: @github
Domain: github.com
{"@context":"https://schema.org","@type":"DiscussionForumPosting","headline":"Nyquist plot with imaginary poles, semi-circles only working after 'trick'","articleBody":"I'm plotting the Nyquist diagram of a transfer function which has poles on the imaginary axis:\r\n\r\n```\r\n\r\nimport control\r\nimport matplotlib.pyplot as plt\r\nimport numpy as np\r\n\r\nK = 1\r\n\r\nGp = control.tf([1], [1,1,0,0,0]) \r\nGc = control.tf([K], [1]) \r\n\r\n\r\ncontrol.nyquist_plot(Gp*Gc,plot=True,omega_num=1000)\r\nplt.show()\r\n\r\n```\r\nWhich results in the following incorrect plot, that does not show infinte semicircles, but something incorrect:\r\n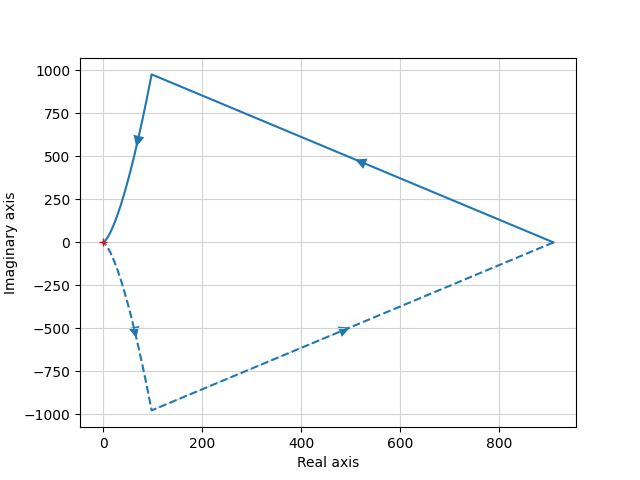\r\n\r\nAlso using `indent_direction` and `indent_radius` did not solve this.\r\nThe trick I found that makes it work is if I add `omega_limits=[0.001,10000]` to nyquist_plot:\r\n\r\n\r\n\r\nCan you please fix such that the incorrect 'line' does not appear? ","author":{"url":"https://github.com/kevindekemele","@type":"Person","name":"kevindekemele"},"datePublished":"2021-04-22T12:42:16.000Z","interactionStatistic":{"@type":"InteractionCounter","interactionType":"https://schema.org/CommentAction","userInteractionCount":2},"url":"https://github.com/613/python-control/issues/613"}| route-pattern | /_view_fragments/issues/show/:user_id/:repository/:id/issue_layout(.:format) |
| route-controller | voltron_issues_fragments |
| route-action | issue_layout |
| fetch-nonce | v2:1f88c2e8-e5c6-dc24-ccb7-c38e2aa50907 |
| current-catalog-service-hash | 81bb79d38c15960b92d99bca9288a9108c7a47b18f2423d0f6438c5b7bcd2114 |
| request-id | EB88:3BB73D:2237AD:2F59D1:697BBAD2 |
| html-safe-nonce | b6037db2a8456ac6d58a8467cef2c86661033f966de04e5f98ba80478caf289f |
| visitor-payload | eyJyZWZlcnJlciI6IiIsInJlcXVlc3RfaWQiOiJFQjg4OjNCQjczRDoyMjM3QUQ6MkY1OUQxOjY5N0JCQUQyIiwidmlzaXRvcl9pZCI6IjM3MjkzMDM2ODA5MzE1NzY1MzAiLCJyZWdpb25fZWRnZSI6ImlhZCIsInJlZ2lvbl9yZW5kZXIiOiJpYWQifQ== |
| visitor-hmac | 1b3e2dda33203edaf19e938ceb386bd935f931c03878d5f96c04e7225a981eba |
| hovercard-subject-tag | issue:864904132 |
| github-keyboard-shortcuts | repository,issues,copilot |
| google-site-verification | Apib7-x98H0j5cPqHWwSMm6dNU4GmODRoqxLiDzdx9I |
| octolytics-url | https://collector.github.com/github/collect |
| analytics-location | / |
| fb:app_id | 1401488693436528 |
| apple-itunes-app | app-id=1477376905, app-argument=https://github.com/_view_fragments/issues/show/python-control/python-control/613/issue_layout |
| twitter:image | https://opengraph.githubassets.com/92f5b8feb83ae4378156ad616915dab33498bc35a54b236d9ecb7a423a13290d/python-control/python-control/issues/613 |
| twitter:card | summary_large_image |
| og:image | https://opengraph.githubassets.com/92f5b8feb83ae4378156ad616915dab33498bc35a54b236d9ecb7a423a13290d/python-control/python-control/issues/613 |
| og:image:alt | I'm plotting the Nyquist diagram of a transfer function which has poles on the imaginary axis: import control import matplotlib.pyplot as plt import numpy as np K = 1 Gp = control.tf([1], [1,1,0,0,... |
| og:image:width | 1200 |
| og:image:height | 600 |
| og:site_name | GitHub |
| og:type | object |
| og:author:username | kevindekemele |
| hostname | github.com |
| expected-hostname | github.com |
| None | ab413746e1b95376981dfec4a04b2384a611b96affe802ee3ee6d752200afbb1 |
| turbo-cache-control | no-preview |
| go-import | github.com/python-control/python-control git https://github.com/python-control/python-control.git |
| octolytics-dimension-user_id | 2285872 |
| octolytics-dimension-user_login | python-control |
| octolytics-dimension-repository_id | 22791752 |
| octolytics-dimension-repository_nwo | python-control/python-control |
| octolytics-dimension-repository_public | true |
| octolytics-dimension-repository_is_fork | false |
| octolytics-dimension-repository_network_root_id | 22791752 |
| octolytics-dimension-repository_network_root_nwo | python-control/python-control |
| turbo-body-classes | logged-out env-production page-responsive |
| disable-turbo | false |
| browser-stats-url | https://api.github.com/_private/browser/stats |
| browser-errors-url | https://api.github.com/_private/browser/errors |
| release | bea0e0f1995ab0bb7fa336572c353032cf897ec1 |
| ui-target | full |
| theme-color | #1e2327 |
| color-scheme | light dark |
Links:
Viewport: width=device-width