Title: problematic step() output: unstable instead of sinusoidal · Issue #384 · python-control/python-control · GitHub
Open Graph Title: problematic step() output: unstable instead of sinusoidal · Issue #384 · python-control/python-control
X Title: problematic step() output: unstable instead of sinusoidal · Issue #384 · python-control/python-control
Description: I am trying to plot step response of a 3rd order process Gp, controlled with a P controller. Gp = 6/[(s+1)(s+2)(s+3)] I am using v0.8.3 from control.matlab import * Gp = tf(6,[1,6,11,6]) Gc = 10 Gor = Gp*Gc/(1 + Gp*Gc) y,t = step(Gor) # ...
Open Graph Description: I am trying to plot step response of a 3rd order process Gp, controlled with a P controller. Gp = 6/[(s+1)(s+2)(s+3)] I am using v0.8.3 from control.matlab import * Gp = tf(6,[1,6,11,6]) Gc = 10 Go...
X Description: I am trying to plot step response of a 3rd order process Gp, controlled with a P controller. Gp = 6/[(s+1)(s+2)(s+3)] I am using v0.8.3 from control.matlab import * Gp = tf(6,[1,6,11,6]) Gc = 10 Go...
Opengraph URL: https://github.com/python-control/python-control/issues/384
X: @github
Domain: github.com
{"@context":"https://schema.org","@type":"DiscussionForumPosting","headline":"problematic step() output: unstable instead of sinusoidal","articleBody":"I am trying to plot step response of a 3rd order process Gp, controlled with a P controller.\r\nGp = 6/[(s+1)(s+2)(s+3)]\r\nI am using v0.8.3\r\n\r\n```python\r\nfrom control.matlab import *\r\n\r\nGp = tf(6,[1,6,11,6])\r\nGc = 10\r\nGor = Gp*Gc/(1 + Gp*Gc)\r\ny,t = step(Gor)\r\n# Plotting code\r\n```\r\n\r\nGor has 3 poles at (-6, sqrt(11) j, - sqrt(11) j ) and the expected behavior is sinusoidal oscillations after the initial transients have died down (ie t \u003e ~ 2/3)\r\nBut what I get is an unstable system: \r\n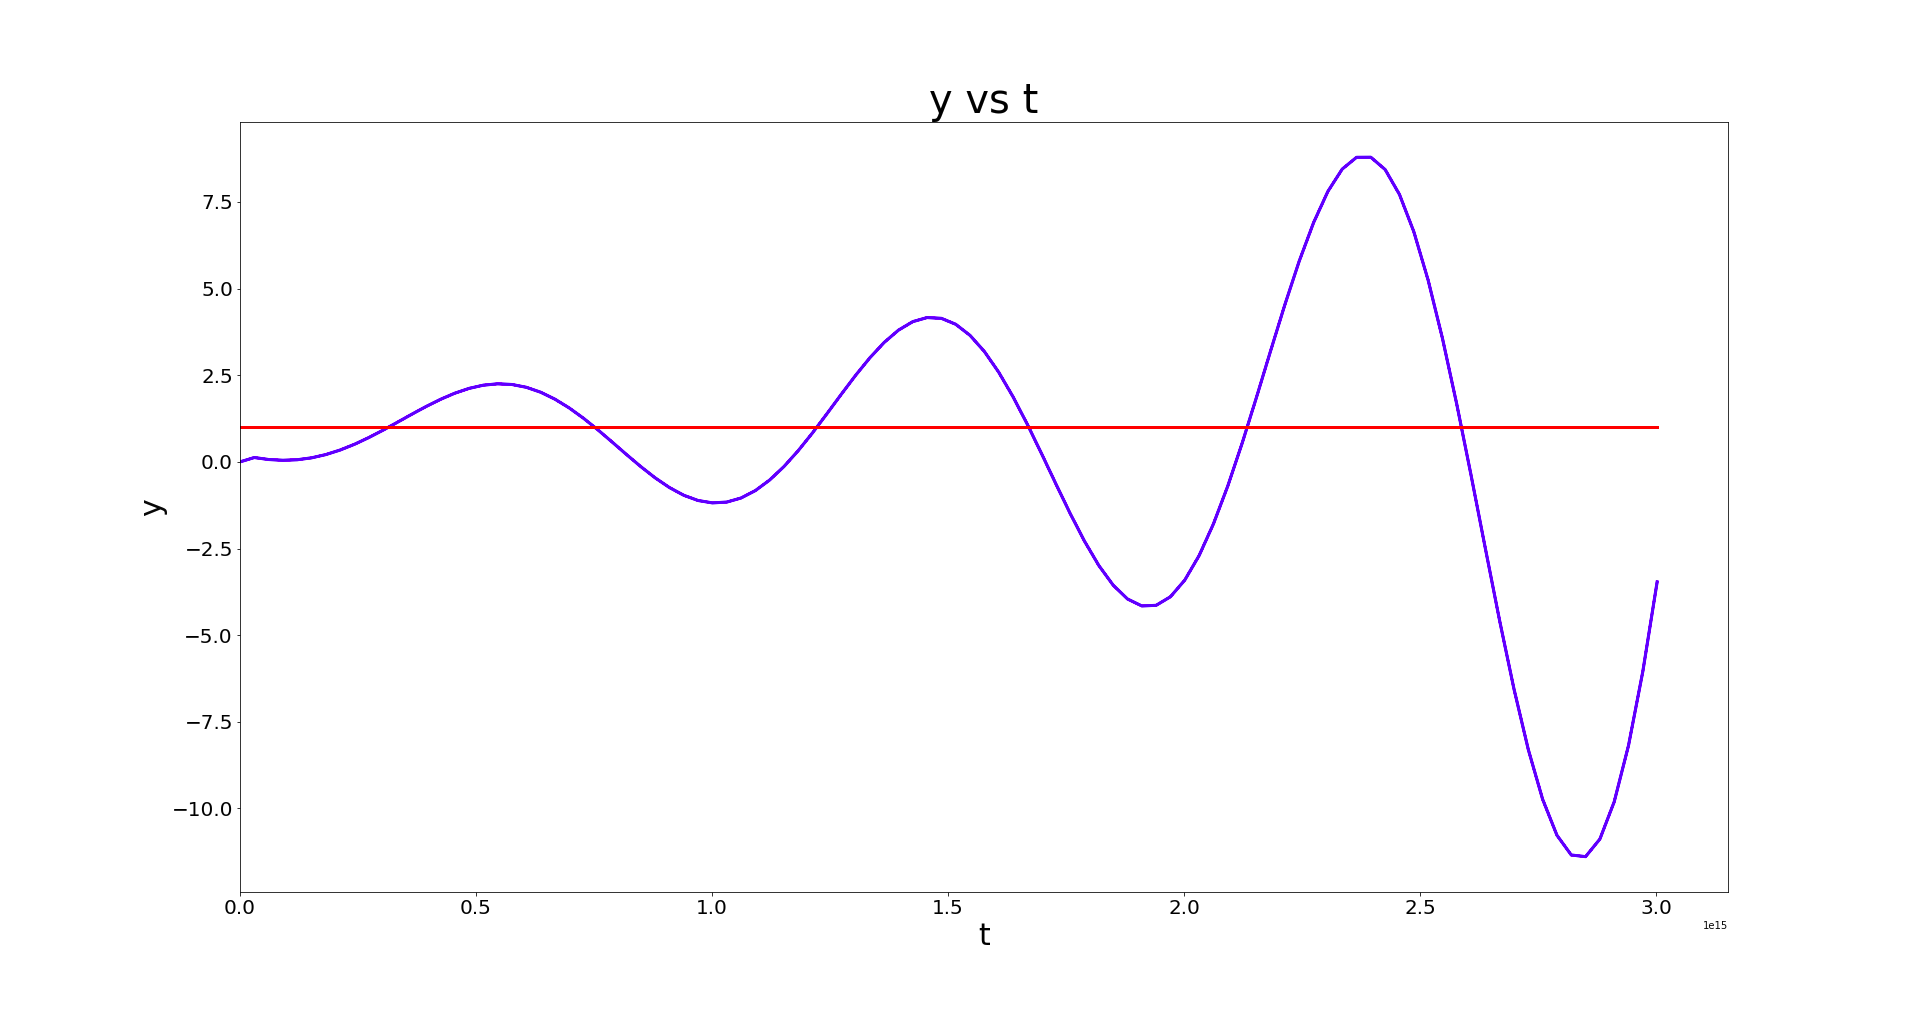\r\n\r\nOctave gives the correct result (ymin 0.113, ymax 1.705 after transients):\r\n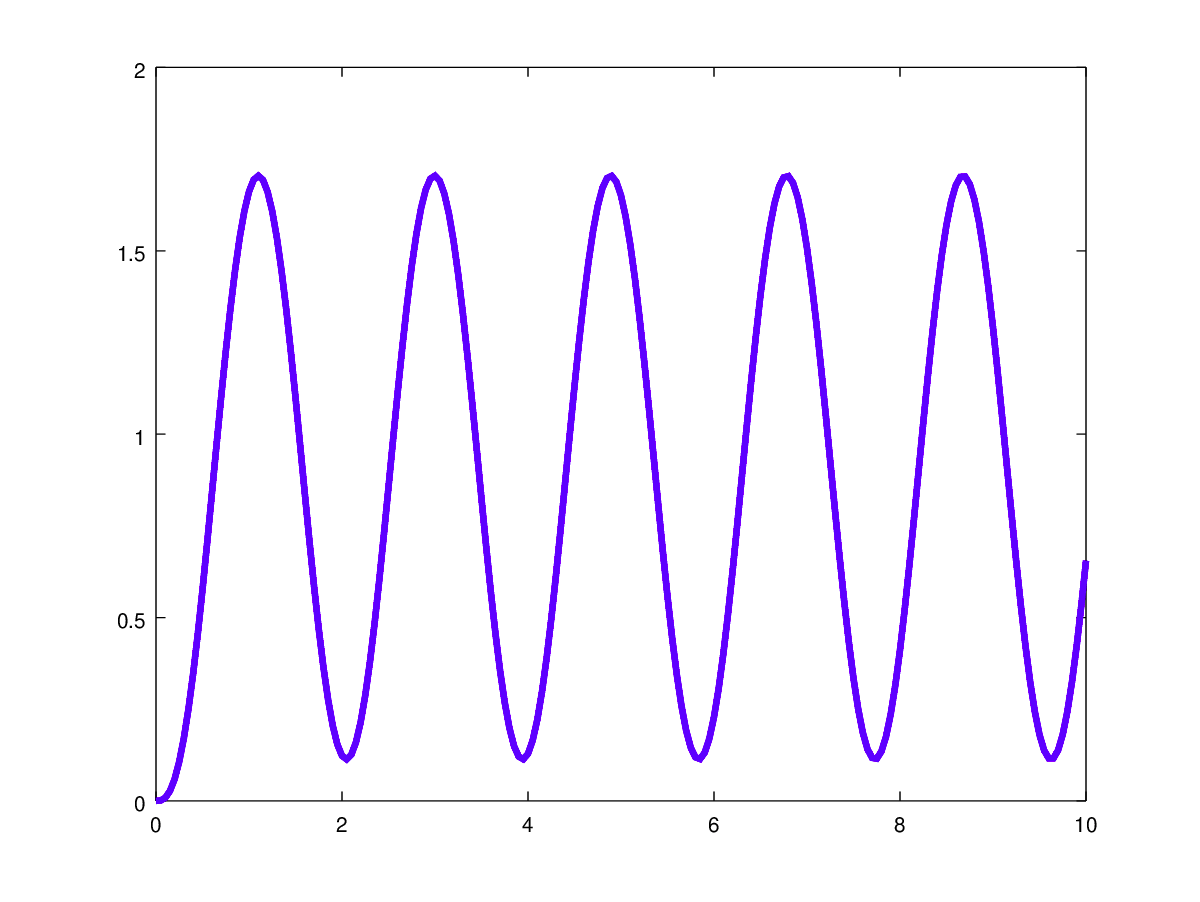\r\n","author":{"url":"https://github.com/prashant2","@type":"Person","name":"prashant2"},"datePublished":"2020-03-24T13:00:57.000Z","interactionStatistic":{"@type":"InteractionCounter","interactionType":"https://schema.org/CommentAction","userInteractionCount":5},"url":"https://github.com/384/python-control/issues/384"}| route-pattern | /_view_fragments/issues/show/:user_id/:repository/:id/issue_layout(.:format) |
| route-controller | voltron_issues_fragments |
| route-action | issue_layout |
| fetch-nonce | v2:4a56157e-39b6-203d-0bd5-3f0cdbb12838 |
| current-catalog-service-hash | 81bb79d38c15960b92d99bca9288a9108c7a47b18f2423d0f6438c5b7bcd2114 |
| request-id | CDE0:1E0A1F:1D1012E:2732950:697AAA69 |
| html-safe-nonce | d496fb250b9037cb8e7b1fb79da631e1a4a3bf26fd5a75818fe4bd53fa23d910 |
| visitor-payload | eyJyZWZlcnJlciI6IiIsInJlcXVlc3RfaWQiOiJDREUwOjFFMEExRjoxRDEwMTJFOjI3MzI5NTA6Njk3QUFBNjkiLCJ2aXNpdG9yX2lkIjoiMTg3NDc4NjA3ODY3ODQ5MzgwMSIsInJlZ2lvbl9lZGdlIjoiaWFkIiwicmVnaW9uX3JlbmRlciI6ImlhZCJ9 |
| visitor-hmac | 6e7549107412ae08d7f29d8329d7a980b03d00fb90de31bd40e9dc307fecae22 |
| hovercard-subject-tag | issue:586942326 |
| github-keyboard-shortcuts | repository,issues,copilot |
| google-site-verification | Apib7-x98H0j5cPqHWwSMm6dNU4GmODRoqxLiDzdx9I |
| octolytics-url | https://collector.github.com/github/collect |
| analytics-location | / |
| fb:app_id | 1401488693436528 |
| apple-itunes-app | app-id=1477376905, app-argument=https://github.com/_view_fragments/issues/show/python-control/python-control/384/issue_layout |
| twitter:image | https://opengraph.githubassets.com/492e6c1eb1e1ea81a3a7c0b2ffa847482ae0295c8882967b7e080ab5ae2e67d6/python-control/python-control/issues/384 |
| twitter:card | summary_large_image |
| og:image | https://opengraph.githubassets.com/492e6c1eb1e1ea81a3a7c0b2ffa847482ae0295c8882967b7e080ab5ae2e67d6/python-control/python-control/issues/384 |
| og:image:alt | I am trying to plot step response of a 3rd order process Gp, controlled with a P controller. Gp = 6/[(s+1)(s+2)(s+3)] I am using v0.8.3 from control.matlab import * Gp = tf(6,[1,6,11,6]) Gc = 10 Go... |
| og:image:width | 1200 |
| og:image:height | 600 |
| og:site_name | GitHub |
| og:type | object |
| og:author:username | prashant2 |
| hostname | github.com |
| expected-hostname | github.com |
| None | 4d375b6c612de26fd037e0638eaf57e32cf9b16daf53ab68c25c04cd3b058113 |
| turbo-cache-control | no-preview |
| go-import | github.com/python-control/python-control git https://github.com/python-control/python-control.git |
| octolytics-dimension-user_id | 2285872 |
| octolytics-dimension-user_login | python-control |
| octolytics-dimension-repository_id | 22791752 |
| octolytics-dimension-repository_nwo | python-control/python-control |
| octolytics-dimension-repository_public | true |
| octolytics-dimension-repository_is_fork | false |
| octolytics-dimension-repository_network_root_id | 22791752 |
| octolytics-dimension-repository_network_root_nwo | python-control/python-control |
| turbo-body-classes | logged-out env-production page-responsive |
| disable-turbo | false |
| browser-stats-url | https://api.github.com/_private/browser/stats |
| browser-errors-url | https://api.github.com/_private/browser/errors |
| release | 5b310e2c1221fb24ffd3f38a097000863d2dfdd4 |
| ui-target | full |
| theme-color | #1e2327 |
| color-scheme | light dark |
Links:
Viewport: width=device-width