Title: sharex, sharey do not work for geographic plot · Issue #199 · proplot-dev/proplot · GitHub
Open Graph Title: sharex, sharey do not work for geographic plot · Issue #199 · proplot-dev/proplot
X Title: sharex, sharey do not work for geographic plot · Issue #199 · proplot-dev/proplot
Description: Description Changing the parameters of sharex, sharey do not work for geographic plot. Thanks always. Steps to reproduce import proplot as plot fig, axs = plot.subplots(ncols=2, nrows=2, proj='cyl', share=3) axs.format(coast=True, labels...
Open Graph Description: Description Changing the parameters of sharex, sharey do not work for geographic plot. Thanks always. Steps to reproduce import proplot as plot fig, axs = plot.subplots(ncols=2, nrows=2, proj='cyl'...
X Description: Description Changing the parameters of sharex, sharey do not work for geographic plot. Thanks always. Steps to reproduce import proplot as plot fig, axs = plot.subplots(ncols=2, nrows=2, proj='...
Opengraph URL: https://github.com/proplot-dev/proplot/issues/199
X: @github
Domain: github.com
{"@context":"https://schema.org","@type":"DiscussionForumPosting","headline":"sharex, sharey do not work for geographic plot","articleBody":"### Description\r\n\r\nChanging the parameters of sharex, sharey do not work for geographic plot.\r\nThanks always.\r\n\r\n### Steps to reproduce\r\n\r\n```python\r\nimport proplot as plot\r\n\r\nfig, axs = plot.subplots(ncols=2, nrows=2, proj='cyl', share=3)\r\naxs.format(coast=True, labels=True)\r\n```\r\n\r\n**Actual behavior**: [What actually happened]\r\n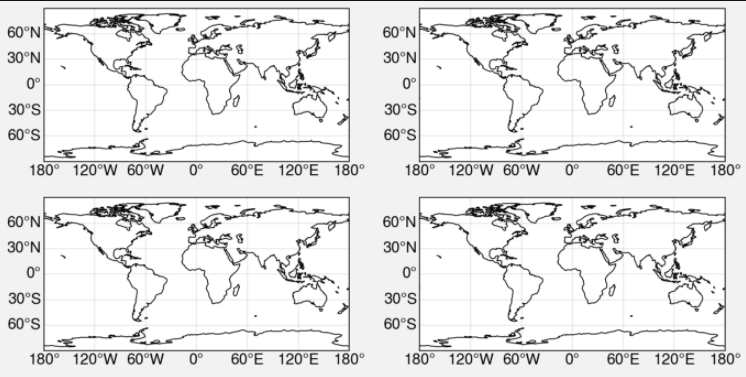\r\n\r\n### Equivalent steps in matplotlib\r\n\r\n\r\n```python\r\nimport numpy as np\r\nimport matplotlib.pyplot as plt\r\nimport cartopy.crs as ccrs\r\nfrom cartopy.mpl.ticker import LongitudeFormatter, LatitudeFormatter\r\n\r\nfig, axes = plt.subplots(2, 2, sharex=True, sharey=True,\r\n subplot_kw=dict(projection=ccrs.PlateCarree()))\r\n\r\nxticks = np.linspace(-180, 180, 7)\r\nyticks = np.linspace(-90, 90, 7)\r\nfor ax in axes.flat:\r\n ax.coastlines()\r\n ax.gridlines(xlocs=xticks, ylocs=yticks, linestyle='--', alpha=0.5)\r\n ax.set_xticks(xticks, crs=ccrs.PlateCarree())\r\n ax.set_yticks(yticks, crs=ccrs.PlateCarree())\r\n ax.xaxis.set_major_formatter(LongitudeFormatter(zero_direction_label=True))\r\n ax.yaxis.set_major_formatter(LatitudeFormatter())\r\n```\r\n\r\n\r\n### Proplot version\r\n\r\n0.6.4","author":{"url":"https://github.com/kinyatoride","@type":"Person","name":"kinyatoride"},"datePublished":"2020-06-26T15:12:10.000Z","interactionStatistic":{"@type":"InteractionCounter","interactionType":"https://schema.org/CommentAction","userInteractionCount":1},"url":"https://github.com/199/proplot/issues/199"}| route-pattern | /_view_fragments/issues/show/:user_id/:repository/:id/issue_layout(.:format) |
| route-controller | voltron_issues_fragments |
| route-action | issue_layout |
| fetch-nonce | v2:c1abce6c-ad7b-1b56-2785-fbe8c85c1326 |
| current-catalog-service-hash | 81bb79d38c15960b92d99bca9288a9108c7a47b18f2423d0f6438c5b7bcd2114 |
| request-id | E2AE:63833:11D68EE:17891D0:696B71E5 |
| html-safe-nonce | 39b87b1fcf2c77e060ccdeee98868c0384e29116ef48e680926e5eb9b8e13e08 |
| visitor-payload | eyJyZWZlcnJlciI6IiIsInJlcXVlc3RfaWQiOiJFMkFFOjYzODMzOjExRDY4RUU6MTc4OTFEMDo2OTZCNzFFNSIsInZpc2l0b3JfaWQiOiI0MTY1NDM1Nzg3MTEwNDc4MzA5IiwicmVnaW9uX2VkZ2UiOiJpYWQiLCJyZWdpb25fcmVuZGVyIjoiaWFkIn0= |
| visitor-hmac | 11c8518022184d2d405d3073e0a25b42623e1a714afb9e28a18bfa9b10a39d35 |
| hovercard-subject-tag | issue:646330619 |
| github-keyboard-shortcuts | repository,issues,copilot |
| google-site-verification | Apib7-x98H0j5cPqHWwSMm6dNU4GmODRoqxLiDzdx9I |
| octolytics-url | https://collector.github.com/github/collect |
| analytics-location | / |
| fb:app_id | 1401488693436528 |
| apple-itunes-app | app-id=1477376905, app-argument=https://github.com/_view_fragments/issues/show/proplot-dev/proplot/199/issue_layout |
| twitter:image | https://opengraph.githubassets.com/530e214e1e12bf269673adda30fb4a9c92a85d80b302fc8feb187e0dba865a30/proplot-dev/proplot/issues/199 |
| twitter:card | summary_large_image |
| og:image | https://opengraph.githubassets.com/530e214e1e12bf269673adda30fb4a9c92a85d80b302fc8feb187e0dba865a30/proplot-dev/proplot/issues/199 |
| og:image:alt | Description Changing the parameters of sharex, sharey do not work for geographic plot. Thanks always. Steps to reproduce import proplot as plot fig, axs = plot.subplots(ncols=2, nrows=2, proj='cyl'... |
| og:image:width | 1200 |
| og:image:height | 600 |
| og:site_name | GitHub |
| og:type | object |
| og:author:username | kinyatoride |
| hostname | github.com |
| expected-hostname | github.com |
| None | 5f99f7c1d70f01da5b93e5ca90303359738944d8ab470e396496262c66e60b8d |
| turbo-cache-control | no-preview |
| go-import | github.com/proplot-dev/proplot git https://github.com/proplot-dev/proplot.git |
| octolytics-dimension-user_id | 108025793 |
| octolytics-dimension-user_login | proplot-dev |
| octolytics-dimension-repository_id | 113293661 |
| octolytics-dimension-repository_nwo | proplot-dev/proplot |
| octolytics-dimension-repository_public | true |
| octolytics-dimension-repository_is_fork | false |
| octolytics-dimension-repository_network_root_id | 113293661 |
| octolytics-dimension-repository_network_root_nwo | proplot-dev/proplot |
| turbo-body-classes | logged-out env-production page-responsive |
| disable-turbo | false |
| browser-stats-url | https://api.github.com/_private/browser/stats |
| browser-errors-url | https://api.github.com/_private/browser/errors |
| release | 82560a55c6b2054555076f46e683151ee28a19bc |
| ui-target | full |
| theme-color | #1e2327 |
| color-scheme | light dark |
Links:
Viewport: width=device-width