Title: scatter colorbar ignores boundaries when outside of plot · Issue #144 · proplot-dev/proplot · GitHub
Open Graph Title: scatter colorbar ignores boundaries when outside of plot · Issue #144 · proplot-dev/proplot
X Title: scatter colorbar ignores boundaries when outside of plot · Issue #144 · proplot-dev/proplot
Description: Description When using the plt.scatter wrapper, if some dimension of the data is mapped to color and the color bar placed externally, it is forced into a discrete colorbar and the boundaries cannot be modified. The colorbar features are ...
Open Graph Description: Description When using the plt.scatter wrapper, if some dimension of the data is mapped to color and the color bar placed externally, it is forced into a discrete colorbar and the boundaries cannot...
X Description: Description When using the plt.scatter wrapper, if some dimension of the data is mapped to color and the color bar placed externally, it is forced into a discrete colorbar and the boundaries cannot...
Opengraph URL: https://github.com/proplot-dev/proplot/issues/144
X: @github
Domain: github.com
{"@context":"https://schema.org","@type":"DiscussionForumPosting","headline":"scatter colorbar ignores boundaries when outside of plot","articleBody":"### Description\r\n\r\nWhen using the `plt.scatter` wrapper, if some dimension of the data is mapped to color and the color bar placed externally, it is forced into a discrete colorbar and the boundaries cannot be modified. The colorbar features are different if placed *inside* the plot.\r\n\r\n1. It would be great for this to generally be fixed.\r\n2. Would it be feasible to add `levels` to the scatter wrapper?\r\n\r\n### Steps to reproduce\r\n\r\n```python\r\nimport numpy as np\r\nimport proplot as plot\r\n\r\nstate = np.random.RandomState(51423)\r\ndata = state.rand(2, 100)\r\n\r\nf, ax = plot.subplots()\r\nax.scatter(*data, marker='o', color=data.sum(axis=0), cmap='Marine',\r\n colorbar='l', vmin=0, vmax=2,\r\n colorbar_kw={'boundaries': plot.arange(0, 2, 0.01),\r\n 'locator': 0.5})\r\n\r\nf, ax = plot.subplots()\r\nax.scatter(*data, marker='o', color=data.sum(axis=0), cmap='Marine',\r\n colorbar='lr', vmin=0, vmax=2,\r\n colorbar_kw={'boundaries': plot.arange(0, 2, 0.01),\r\n 'locator': 0.5})\r\n```\r\n\r\nIn the first bit, I am using `boundaries` as a hack to get at `levels`. I want to force this to much smaller colorbar steps, just to prove that it's working. It seems like `locator` works, but not `boundaries` for instance.\r\n\r\n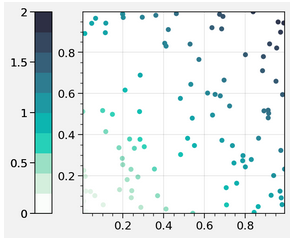\r\n\r\nIn the second bit, when `colorbar='lr'`, it works fine. I.e., when colorbars are inside the plot, the `boundaries` keyword works. When placed outside (e.g. `l`, `r`, `b`), the colorbar is funky.\r\n\r\n\r\n\r\n### Equivalent steps in matplotlib\r\n\r\nThe default exterior colorbar in `matplotlib` looks a lot better (it's continuous without mislabeling of the discrete boundaries), and the `boundaries` keyword works here.\r\n\r\n```python\r\nimport matplotlib.pyplot as plt\r\nstate = np.random.RandomState(51423)\r\ndata = state.rand(2, 100)\r\n\r\n\r\nf, ax = plt.subplots()\r\np = ax.scatter(*data, marker='o', c=data.sum(axis=0))\r\n\r\nf.colorbar(p, boundaries=plot.arange(0, 2, 0.1))\r\n```\r\n\r\n\r\n\r\n\r\n\r\n### Proplot version\r\n0.5.0.post46\r\n","author":{"url":"https://github.com/bradyrx","@type":"Person","name":"bradyrx"},"datePublished":"2020-04-22T20:56:00.000Z","interactionStatistic":{"@type":"InteractionCounter","interactionType":"https://schema.org/CommentAction","userInteractionCount":3},"url":"https://github.com/144/proplot/issues/144"}| route-pattern | /_view_fragments/issues/show/:user_id/:repository/:id/issue_layout(.:format) |
| route-controller | voltron_issues_fragments |
| route-action | issue_layout |
| fetch-nonce | v2:0f20df2c-ce76-af81-d247-96829b12a17e |
| current-catalog-service-hash | 81bb79d38c15960b92d99bca9288a9108c7a47b18f2423d0f6438c5b7bcd2114 |
| request-id | 851E:1012B6:1D26825:28600DA:697CADC7 |
| html-safe-nonce | 0c2898565462cabc3c6c2b22fa3e32e5f7d8c67300272bbb048d7b1156865d5f |
| visitor-payload | eyJyZWZlcnJlciI6IiIsInJlcXVlc3RfaWQiOiI4NTFFOjEwMTJCNjoxRDI2ODI1OjI4NjAwREE6Njk3Q0FEQzciLCJ2aXNpdG9yX2lkIjoiNjk5MTk3MjMyNzQ1Nzg2MTA2MyIsInJlZ2lvbl9lZGdlIjoiaWFkIiwicmVnaW9uX3JlbmRlciI6ImlhZCJ9 |
| visitor-hmac | c53844e1de45ac3312a18a2b98b038a3e7c91a9fe8ecdc2eea29d0eb1e8be1c5 |
| hovercard-subject-tag | issue:605069232 |
| github-keyboard-shortcuts | repository,issues,copilot |
| google-site-verification | Apib7-x98H0j5cPqHWwSMm6dNU4GmODRoqxLiDzdx9I |
| octolytics-url | https://collector.github.com/github/collect |
| analytics-location | / |
| fb:app_id | 1401488693436528 |
| apple-itunes-app | app-id=1477376905, app-argument=https://github.com/_view_fragments/issues/show/proplot-dev/proplot/144/issue_layout |
| twitter:image | https://opengraph.githubassets.com/d1ed2536c2f7d0f8a96be9aed2e0219d073215ab91e62850a539b09254f24745/proplot-dev/proplot/issues/144 |
| twitter:card | summary_large_image |
| og:image | https://opengraph.githubassets.com/d1ed2536c2f7d0f8a96be9aed2e0219d073215ab91e62850a539b09254f24745/proplot-dev/proplot/issues/144 |
| og:image:alt | Description When using the plt.scatter wrapper, if some dimension of the data is mapped to color and the color bar placed externally, it is forced into a discrete colorbar and the boundaries cannot... |
| og:image:width | 1200 |
| og:image:height | 600 |
| og:site_name | GitHub |
| og:type | object |
| og:author:username | bradyrx |
| hostname | github.com |
| expected-hostname | github.com |
| None | 5bdfd06d077d4bc79a8063f7549f208cda3158f1322903029653dc97f57b937a |
| turbo-cache-control | no-preview |
| go-import | github.com/proplot-dev/proplot git https://github.com/proplot-dev/proplot.git |
| octolytics-dimension-user_id | 108025793 |
| octolytics-dimension-user_login | proplot-dev |
| octolytics-dimension-repository_id | 113293661 |
| octolytics-dimension-repository_nwo | proplot-dev/proplot |
| octolytics-dimension-repository_public | true |
| octolytics-dimension-repository_is_fork | false |
| octolytics-dimension-repository_network_root_id | 113293661 |
| octolytics-dimension-repository_network_root_nwo | proplot-dev/proplot |
| turbo-body-classes | logged-out env-production page-responsive |
| disable-turbo | false |
| browser-stats-url | https://api.github.com/_private/browser/stats |
| browser-errors-url | https://api.github.com/_private/browser/errors |
| release | f8a309d88087f59ff1a2f2cd9e9e79ed01a7b84e |
| ui-target | canary-2 |
| theme-color | #1e2327 |
| color-scheme | light dark |
Links:
Viewport: width=device-width