Title: incorrect representation of mixed rgb and rgba colors in mesh3d · Issue #2306 · plotly/plotly.py · GitHub
Open Graph Title: incorrect representation of mixed rgb and rgba colors in mesh3d · Issue #2306 · plotly/plotly.py
X Title: incorrect representation of mixed rgb and rgba colors in mesh3d · Issue #2306 · plotly/plotly.py
Description: Hi folks! I encountered some unexpected behavior in Mesh3d. I hope you could have a look. It is hard for me to judge if these are issues, here or upstream, or I am missing something. Incorrect colors in plots with intensity and a discont...
Open Graph Description: Hi folks! I encountered some unexpected behavior in Mesh3d. I hope you could have a look. It is hard for me to judge if these are issues, here or upstream, or I am missing something. Incorrect colo...
X Description: Hi folks! I encountered some unexpected behavior in Mesh3d. I hope you could have a look. It is hard for me to judge if these are issues, here or upstream, or I am missing something. Incorrect colo...
Opengraph URL: https://github.com/plotly/plotly.py/issues/2306
X: @github
Domain: github.com
{"@context":"https://schema.org","@type":"DiscussionForumPosting","headline":"incorrect representation of mixed rgb and rgba colors in mesh3d","articleBody":"Hi folks!\r\n\r\nI encountered some unexpected behavior in `Mesh3d`. I hope you could have a look. It is hard for me to judge if these are issues, here or upstream, or I am missing something. \r\n\r\n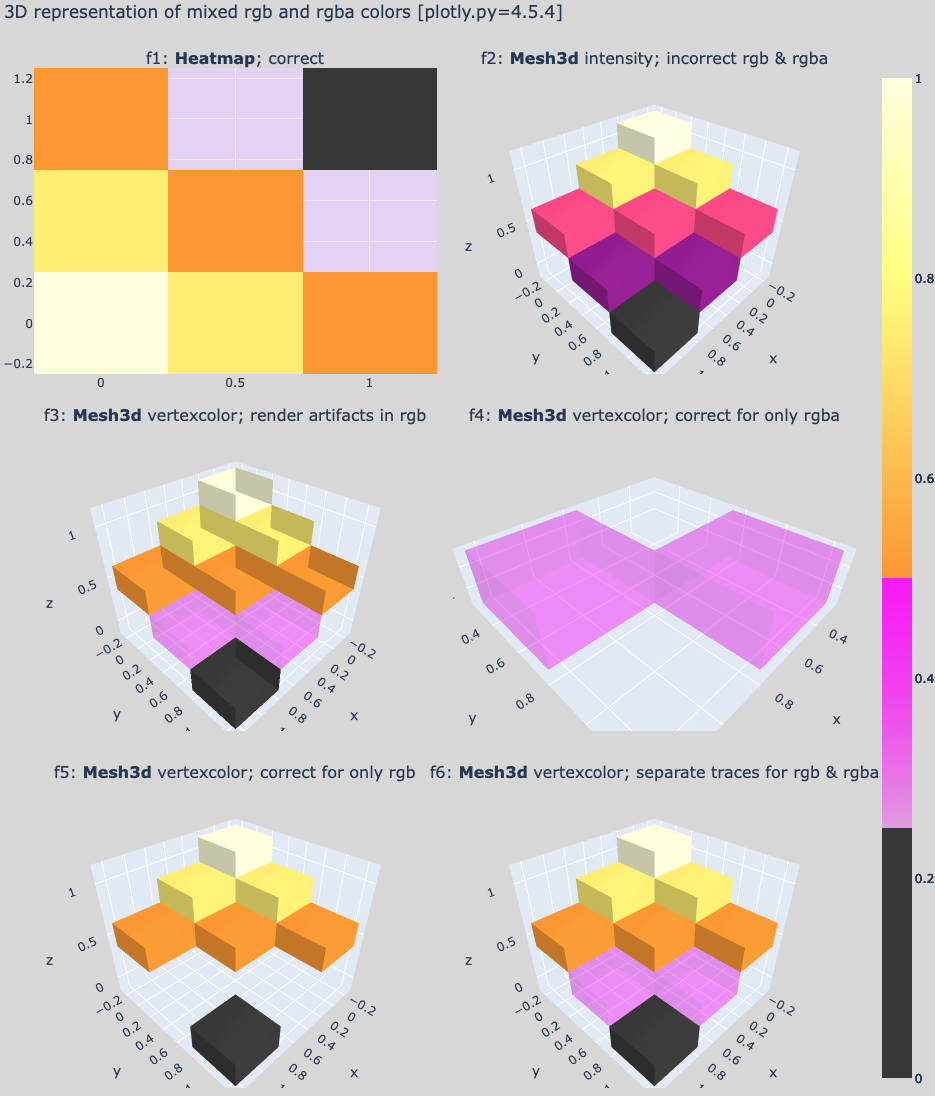\r\n\r\n1. Incorrect colors in plots with `intensity` and a **discontinuous** `colorscale` (see panel f2). \r\n a) Colors with opacity (rgba) are shown without opacity (rgb). This issue was reported before.\r\n b) Discontinuous transitions in the `colorscale` appear to be ignored. As a result, colors are introduced that are not found in the colorscale. In the example, panel f2: purple = black + magenta, raspberry = magenta + orange.\r\n c) I would expect the same colorscale behavior as in 'scatter' or 'heatmap' (panel f1). \r\n\r\n2. Render artifacts occur for `facecolor` or `vertexcolor` surfaces, when rgb and rgba colors are put in the same trace (see panel f3).\r\n a) Surfaces do look opaque when _only_ rgb colors are present (panel f5). \r\n b) A partial workaround was to plot rgb and rgba vertices in separate traces (panel f6). Not sure what to do when vertices have a gradient between rgb and rgba...\r\n\r\n3. An additional trace is needed to add a colorbar when `facecolor` or `vertexcolor` is used instead of `intensity`.\r\n a) I do expect the colorbar to be dropped when colors are hardcoded. But the workaround to add a custom `colorbar` or `coloraxis` with a 'hidden' trace may not be obvious to everyone. Add an example to the documentation?\r\n\r\n4. The rgba colors in the `colorbar` appear mixed with layout `paper_bgcolor`, effectively the transparent magenta colors are too dark in the Working Example. \r\n a) Can a `colorbar` background be set to match the (default) plot background color?\r\n\r\n5. The image above is a screenshot and differs from the exported image, using `f7.write_image(...)` after the Working Example below.\r\n a) In my exported copy, some of the layout `scene` axes appeared 'ghost'-duplicated into the next subplot. Only visible if the scene axes (ranges) change between subplots. Issue on my system or in Orca?\r\n\r\nScreenshot 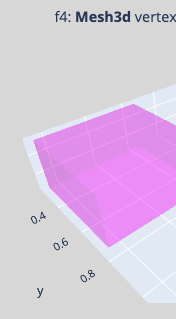 _vs_ Orca[1.3.0] 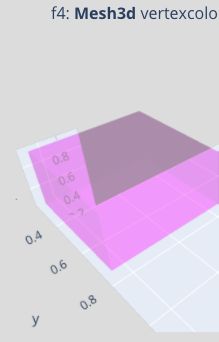\r\n\r\nFinally, for a large number of shapes (or animations) I noticed significant performance loss in looking up and hardcoding the colors of vertices. Ideally, I would get the `intensity` method of `Mesh3d` to give me the expected result (more like f6, less like f2). Any ideas? **Your advise is appreciated!** \r\n\r\n\r\n```python\r\nimport numpy as np\r\nimport itertools\r\nimport plotly as py\r\nimport plotly.graph_objects as go\r\nfrom plotly.subplots import make_subplots\r\n\r\ndef flatten_dict(d):\r\n return({k: [y for x in [v[k] for v in d] for y in x] for k in d[0]})\r\n\r\ndef reindex_voxels(dl):\r\n m=0\r\n res = []\r\n for i,od in enumerate(dl):\r\n ix = len(dl[i]['x'])\r\n d = od.copy()\r\n for n in ['i','j','k']:\r\n d[n] = [ m + j for j in d[n] ]\r\n m += ix\r\n res.append(d)\r\n return(flatten_dict(res))\r\n\r\n# some data\r\nx = y = np.linspace(0,1,3)\r\nx,y = np.meshgrid(x,y)\r\nz = 1-(x+y)/2 \r\n\r\n# custom colorscale, mixed rgb and rgba, discontinuous breaks\r\ncs = [[0.0, 'rgb(64, 64, 64)'],\r\n [0.25, 'rgb(64, 64, 64)'],\r\n [0.25, 'rgba(255, 0, 255, 0.1)'],\r\n [0.5, 'rgba(255, 0, 255, 0.5)'],\r\n [0.5, 'rgb(255, 160, 33)'],\r\n [0.8, 'rgb(255, 255, 129)'],\r\n [1.0, 'rgb(255, 255, 225)']]\r\n\r\n# list of shapes\r\nvxl = \\\r\n[{'x': [-0.25, -0.25, 0.25, 0.25, -0.25, -0.25, 0.25, 0.25],\r\n 'y': [-0.25, 0.25, 0.25, -0.25, -0.25, 0.25, 0.25, -0.25],\r\n 'z': [0.875, 0.875, 0.875, 0.875, 1.125, 1.125, 1.125, 1.125],\r\n 'i': [7, 0, 0, 0, 4, 4, 2, 6, 4, 0, 3, 7],\r\n 'j': [3, 4, 1, 2, 5, 6, 5, 5, 0, 1, 2, 2],\r\n 'k': [0, 7, 2, 3, 6, 7, 1, 2, 5, 5, 7, 6],\r\n 'intensity': [1.0, 1.0, 1.0, 1.0, 1.0, 1.0, 1.0, 1.0]},\r\n {'x': [0.25, 0.25, 0.75, 0.75, 0.25, 0.25, 0.75, 0.75],\r\n 'y': [-0.25, 0.25, 0.25, -0.25, -0.25, 0.25, 0.25, -0.25],\r\n 'z': [0.625, 0.625, 0.625, 0.625, 0.875, 0.875, 0.875, 0.875],\r\n 'i': [7, 0, 0, 0, 4, 4, 2, 6, 4, 0, 3, 7],\r\n 'j': [3, 4, 1, 2, 5, 6, 5, 5, 0, 1, 2, 2],\r\n 'k': [0, 7, 2, 3, 6, 7, 1, 2, 5, 5, 7, 6],\r\n 'intensity': [0.75, 0.75, 0.75, 0.75, 0.75, 0.75, 0.75, 0.75]},\r\n {'x': [0.75, 0.75, 1.25, 1.25, 0.75, 0.75, 1.25, 1.25],\r\n 'y': [-0.25, 0.25, 0.25, -0.25, -0.25, 0.25, 0.25, -0.25],\r\n 'z': [0.375, 0.375, 0.375, 0.375, 0.625, 0.625, 0.625, 0.625],\r\n 'i': [7, 0, 0, 0, 4, 4, 2, 6, 4, 0, 3, 7],\r\n 'j': [3, 4, 1, 2, 5, 6, 5, 5, 0, 1, 2, 2],\r\n 'k': [0, 7, 2, 3, 6, 7, 1, 2, 5, 5, 7, 6],\r\n 'intensity': [0.5, 0.5, 0.5, 0.5, 0.5, 0.5, 0.5, 0.5]},\r\n {'x': [-0.25, -0.25, 0.25, 0.25, -0.25, -0.25, 0.25, 0.25],\r\n 'y': [0.25, 0.75, 0.75, 0.25, 0.25, 0.75, 0.75, 0.25],\r\n 'z': [0.625, 0.625, 0.625, 0.625, 0.875, 0.875, 0.875, 0.875],\r\n 'i': [7, 0, 0, 0, 4, 4, 2, 6, 4, 0, 3, 7],\r\n 'j': [3, 4, 1, 2, 5, 6, 5, 5, 0, 1, 2, 2],\r\n 'k': [0, 7, 2, 3, 6, 7, 1, 2, 5, 5, 7, 6],\r\n 'intensity': [0.75, 0.75, 0.75, 0.75, 0.75, 0.75, 0.75, 0.75]},\r\n {'x': [0.25, 0.25, 0.75, 0.75, 0.25, 0.25, 0.75, 0.75],\r\n 'y': [0.25, 0.75, 0.75, 0.25, 0.25, 0.75, 0.75, 0.25],\r\n 'z': [0.375, 0.375, 0.375, 0.375, 0.625, 0.625, 0.625, 0.625],\r\n 'i': [7, 0, 0, 0, 4, 4, 2, 6, 4, 0, 3, 7],\r\n 'j': [3, 4, 1, 2, 5, 6, 5, 5, 0, 1, 2, 2],\r\n 'k': [0, 7, 2, 3, 6, 7, 1, 2, 5, 5, 7, 6],\r\n 'intensity': [0.5, 0.5, 0.5, 0.5, 0.5, 0.5, 0.5, 0.5]},\r\n {'x': [0.75, 0.75, 1.25, 1.25, 0.75, 0.75, 1.25, 1.25],\r\n 'y': [0.25, 0.75, 0.75, 0.25, 0.25, 0.75, 0.75, 0.25],\r\n 'z': [0.125, 0.125, 0.125, 0.125, 0.375, 0.375, 0.375, 0.375],\r\n 'i': [7, 0, 0, 0, 4, 4, 2, 6, 4, 0, 3, 7],\r\n 'j': [3, 4, 1, 2, 5, 6, 5, 5, 0, 1, 2, 2],\r\n 'k': [0, 7, 2, 3, 6, 7, 1, 2, 5, 5, 7, 6],\r\n 'intensity': [0.25, 0.25, 0.25, 0.25, 0.25, 0.25, 0.25, 0.25]},\r\n {'x': [-0.25, -0.25, 0.25, 0.25, -0.25, -0.25, 0.25, 0.25],\r\n 'y': [0.75, 1.25, 1.25, 0.75, 0.75, 1.25, 1.25, 0.75],\r\n 'z': [0.375, 0.375, 0.375, 0.375, 0.625, 0.625, 0.625, 0.625],\r\n 'i': [7, 0, 0, 0, 4, 4, 2, 6, 4, 0, 3, 7],\r\n 'j': [3, 4, 1, 2, 5, 6, 5, 5, 0, 1, 2, 2],\r\n 'k': [0, 7, 2, 3, 6, 7, 1, 2, 5, 5, 7, 6],\r\n 'intensity': [0.5, 0.5, 0.5, 0.5, 0.5, 0.5, 0.5, 0.5]},\r\n {'x': [0.25, 0.25, 0.75, 0.75, 0.25, 0.25, 0.75, 0.75],\r\n 'y': [0.75, 1.25, 1.25, 0.75, 0.75, 1.25, 1.25, 0.75],\r\n 'z': [0.125, 0.125, 0.125, 0.125, 0.375, 0.375, 0.375, 0.375],\r\n 'i': [7, 0, 0, 0, 4, 4, 2, 6, 4, 0, 3, 7],\r\n 'j': [3, 4, 1, 2, 5, 6, 5, 5, 0, 1, 2, 2],\r\n 'k': [0, 7, 2, 3, 6, 7, 1, 2, 5, 5, 7, 6],\r\n 'intensity': [0.25, 0.25, 0.25, 0.25, 0.25, 0.25, 0.25, 0.25]},\r\n {'x': [0.75, 0.75, 1.25, 1.25, 0.75, 0.75, 1.25, 1.25],\r\n 'y': [0.75, 1.25, 1.25, 0.75, 0.75, 1.25, 1.25, 0.75],\r\n 'z': [-0.125, -0.125, -0.125, -0.125, 0.125, 0.125, 0.125, 0.125],\r\n 'i': [7, 0, 0, 0, 4, 4, 2, 6, 4, 0, 3, 7],\r\n 'j': [3, 4, 1, 2, 5, 6, 5, 5, 0, 1, 2, 2],\r\n 'k': [0, 7, 2, 3, 6, 7, 1, 2, 5, 5, 7, 6],\r\n 'intensity': [0.0, 0.0, 0.0, 0.0, 0.0, 0.0, 0.0, 0.0]}]\r\n\r\n# shape colors\r\ncid = ['rgb(255, 255, 220)','rgb(255, 239, 113)', \r\n 'rgb(255, 160, 33)','rgb(255, 239, 113)',\r\n 'rgb(255, 160, 33)','rgba(255, 0, 255, 0.2)',\r\n 'rgb(255, 160, 33)','rgba(255, 0, 255, 0.2)', \r\n 'rgb(64, 64, 64)']\r\n\r\n# concatenate shapes\r\nvxa = reindex_voxels(vxl)\r\n\r\n# concatenate and replace 'intensity' with 'vertexcolor'\r\nvxb = reindex_voxels([{**{i:j for i,j in v.items() if i in ['x','y','z','i','j','k']},\r\n **{'vertexcolor': [k]*len(v['x'])}} for k,v in zip(cid,vxl)])\r\n\r\n# split vertices with opacity (rgba) and without opacity (rgb) , and replace 'intensity' by 'vertexcolor'\r\nvxc0 = reindex_voxels([{**{i:j for i,j in v.items() if i in ['x','y','z','i','j','k']},\r\n **{'vertexcolor': [k]*len(v['x'])}} for k,v in zip(cid,vxl) if k.startswith('rgba(')])\r\nvxc1 = reindex_voxels([{**{i:j for i,j in v.items() if i in ['x','y','z','i','j','k']},\r\n **{'vertexcolor': [k]*len(v['x'])}} for k,v in zip(cid,vxl) if k.startswith('rgb(')])\r\n\r\n# figures\r\nf1 = go.Figure(data=[go.Heatmap(x=x.ravel(),y=y.ravel(),z=z.ravel(),colorscale=cs)])\r\nf2 = go.Figure(data=[go.Mesh3d(**vxa,colorscale=cs)])\r\nf3 = go.Figure(data=[go.Mesh3d(**vxb,colorscale=cs)])\r\nf4 = go.Figure(data=[go.Mesh3d(**vxc0)])\r\nf5 = go.Figure(data=[go.Mesh3d(**vxc1)])\r\n\r\n# multiple traces; 'vertexcolor' for rgb and rgba _and_ a transparent trace with 'intensity' to add a 'colorscale'\r\nf6 = go.Figure(data=[go.Mesh3d(**vxc0),\r\n go.Mesh3d(**vxc1),\r\n go.Mesh3d(**vxa,opacity=0,colorscale=cs)])\r\n\r\n#f6.show() \r\n\r\n# merge figures\r\nncol=2\r\nnrow=3\r\nfig = make_subplots(cols=ncol,rows=nrow,vertical_spacing=0.05,horizontal_spacing=0.02,\r\n specs= ( np.array([{'type':'heatmap'},{'type':'scatter3d'}]+[{'type':'scatter3d'}]*4)\r\n .reshape(nrow,ncol).tolist() ),\r\n subplot_titles=['f1: \u003cb>Heatmap\u003c/b>; correct',\r\n 'f2: \u003cb>Mesh3d\u003c/b> intensity; incorrect rgb & rgba',\r\n 'f3: \u003cb>Mesh3d\u003c/b> vertexcolor; render artifacts in rgb',\r\n 'f4: \u003cb>Mesh3d\u003c/b> vertexcolor; correct for only rgba',\r\n 'f5: \u003cb>Mesh3d\u003c/b> vertexcolor; correct for only rgb',\r\n 'f6: \u003cb>Mesh3d\u003c/b> vertexcolor; separate traces for rgb & rgba'])\r\nfig.update_layout(height=1200,width=1000,title_text='3D representation of mixed rgb and rgba colors [plotly.py={}]'.format(py.__version__))\r\n\r\nf7 = go.Figure(fig)\r\nfor loc,f in zip(list(itertools.product(*[range(1,nrow+1),range(1,ncol+1)])),[f1,f2,f3,f4,f5,f6]):\r\n if f is not None:\r\n for d in f['data']:\r\n f7.add_trace(d,row=loc[0],col=loc[1]) \r\n\r\nf7.show()\r\n```\r\nSorry, not a very short MWE...","author":{"url":"https://github.com/z--m-n","@type":"Person","name":"z--m-n"},"datePublished":"2020-03-23T17:24:07Z","url":"https://github.com/plotly/plotly.py/issues/2306"}| react-profiling | 0 |
| react-import-map | react,react-dom,react-dom/client,react-dom/profiling,react-is,react/compiler-runtime,react/jsx-dev-runtime,react/jsx-runtime,scheduler@b8488ee2c322 |
| route-pattern | /_view_fragments/issues/show/:user_id/:repository/:id/issue_layout(.:format) |
| route-controller | voltron_issues_fragments |
| route-action | issue_layout |
| fetch-nonce | v2:7784bb9d-3c25-7bb2-759a-9851d61011f0 |
| current-catalog-service-hash | 81bb79d38c15960b92d99bca9288a9108c7a47b18f2423d0f6438c5b7bcd2114 |
| request-id | 91C8:33D24F:29FF589:35F0082:6B01B4FD |
| html-safe-nonce | cf87237203b3aa1490945c7f529fbbb835bf9d32ad1dd230f8f4a29a029c7a45 |
| visitor-payload | eyJyZWZlcnJlciI6IiIsInJlcXVlc3RfaWQiOiI5MUM4OjMzRDI0RjoyOUZGNTg5OjM1RjAwODI6NkIwMUI0RkQiLCJ2aXNpdG9yX2lkIjoiMTI1NDM3OTUzNDU2MDYzODIwNSIsInJlZ2lvbl9lZGdlIjoiaWFkIiwicmVnaW9uX3JlbmRlciI6ImlhZCJ9 |
| visitor-hmac | 5c63bfe458e1c547ba0e4fe3ea3efe9e6a61b7f34023368674a30c7d3f135d73 |
| hovercard-subject-tag | issue:586384766 |
| github-keyboard-shortcuts | repository,issues,copilot |
| google-site-verification | Apib7-x98H0j5cPqHWwSMm6dNU4GmODRoqxLiDzdx9I |
| octolytics-url | https://collector.github.com/github/collect |
| analytics-location | / |
| fb:app_id | 1401488693436528 |
| apple-itunes-app | app-id=1477376905, app-argument=https://github.com/_view_fragments/issues/show/plotly/plotly.py/2306/issue_layout |
| twitter:image | https://opengraph.githubassets.com/963420488390f1290e7b178331456bd37553264baa4ffda32b0c7cff23b669fb/plotly/plotly.py/issues/2306 |
| twitter:card | summary_large_image |
| og:image | https://opengraph.githubassets.com/963420488390f1290e7b178331456bd37553264baa4ffda32b0c7cff23b669fb/plotly/plotly.py/issues/2306 |
| og:image:alt | Hi folks! I encountered some unexpected behavior in Mesh3d. I hope you could have a look. It is hard for me to judge if these are issues, here or upstream, or I am missing something. Incorrect colo... |
| og:image:width | 1200 |
| og:image:height | 600 |
| og:site_name | GitHub |
| og:type | object |
| og:author:username | z--m-n |
| hostname | github.com |
| expected-hostname | github.com |
| None | cc5dfdd32f62ebd3223cab3af3aa2b268d3605218237326a48a99d1efd89495c |
| turbo-cache-control | no-preview |
| go-import | github.com/plotly/plotly.py git https://github.com/plotly/plotly.py.git |
| octolytics-dimension-user_id | 5997976 |
| octolytics-dimension-user_login | plotly |
| octolytics-dimension-repository_id | 14579099 |
| octolytics-dimension-repository_nwo | plotly/plotly.py |
| octolytics-dimension-repository_public | true |
| octolytics-dimension-repository_is_fork | false |
| octolytics-dimension-repository_network_root_id | 14579099 |
| octolytics-dimension-repository_network_root_nwo | plotly/plotly.py |
| turbo-body-classes | logged-out env-production page-responsive |
| disable-turbo | false |
| browser-stats-url | https://api.github.com/_private/browser/stats |
| browser-errors-url | https://api.github.com/_private/browser/errors |
| release | 8c77c9e8439031ad54c75a250694842892f693e1 |
| ui-target | full |
| theme-color | #1e2327 |
| color-scheme | light dark |
| react-app-name | issues |
Links:
Viewport: width=device-width


