Title: scatter3d.line.showscale doesn't show a colorscale · Issue #2862 · plotly/plotly.js · GitHub
Open Graph Title: scatter3d.line.showscale doesn't show a colorscale · Issue #2862 · plotly/plotly.js
X Title: scatter3d.line.showscale doesn't show a colorscale · Issue #2862 · plotly/plotly.js
Description: Open-source JavaScript charting library behind Plotly and Dash - scatter3d.line.showscale doesn't show a colorscale · Issue #2862 · plotly/plotly.js
Open Graph Description: Open-source JavaScript charting library behind Plotly and Dash - scatter3d.line.showscale doesn't show a colorscale · Issue #2862 · plotly/plotly.js
X Description: Open-source JavaScript charting library behind Plotly and Dash - scatter3d.line.showscale doesn't show a colorscale · Issue #2862 · plotly/plotly.js
Opengraph URL: https://github.com/plotly/plotly.js
X: @github
Domain: github.com
{"@context":"https://schema.org","@type":"DiscussionForumPosting","headline":"scatter3d.line.showscale doesn't show a colorscale","articleBody":"This report is a translation of https://github.com/plotly/plotly.py/issues/1085\r\n\r\nIt seems that the `scatter3d.line.color` and `scatter3d.line.colorscale` properties can be used to specify a line with a variable color along it's path (which is awesome!). There is also as `scatter3d.line.showscale` property in the schema, but setting this to `true` does not show a colorscale.\r\n\r\nNot sure if the bug is the scale not showing, or the presence of the `showscale` property. Thanks!\r\n\r\nCodepen: https://codepen.io/anon/pen/vaRLgy\r\n\r\n```javascript\r\nx = [0, 0, 0]\r\ny = [1, 1, 1]\r\nz = [1, 2, 3]\r\nc = [0, 1, 2]\r\nvar trace1 = {\r\n type: 'scatter3d',\r\n x: x,\r\n y: y,\r\n z: z,\r\n mode: \"lines\",\r\n line: {\r\n color: c,\r\n showscale: true,\r\n width: 10\r\n }\r\n}\r\n\r\n\r\nvar data = [ trace1 ];\r\n\r\nvar layout = {};\r\n\r\nPlotly.newPlot('myDiv', data, layout);\r\n```\r\n\r\n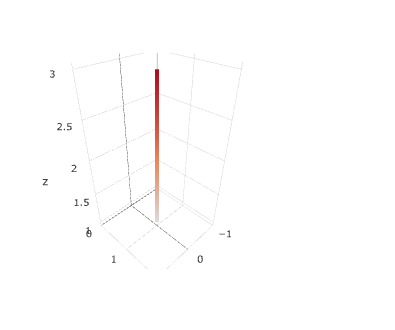\r\n","author":{"url":"https://github.com/jonmmease","@type":"Person","name":"jonmmease"},"datePublished":"2018-08-01T09:32:51Z","url":"https://github.com/plotly/plotly.js/issues/2862"}| react-profiling | 0 |
| react-import-map | react,react-dom,react-dom/client,react-dom/profiling,react-is,react/compiler-runtime,react/jsx-dev-runtime,react/jsx-runtime,scheduler@b8488ee2c322 |
| route-pattern | /:user_id/:repository/issues/:id(.:format) |
| route-controller | issues |
| route-action | show |
| fetch-nonce | v2:26d8121c-067b-ce06-accd-e6406cccc4ce |
| current-catalog-service-hash | 81bb79d38c15960b92d99bca9288a9108c7a47b18f2423d0f6438c5b7bcd2114 |
| request-id | E422:215B92:23F0069:2FD605D:6B01975D |
| html-safe-nonce | d3d456d7854226210968895df4de7cc3efe36a0bf6b3d2290629c6ee4edee12b |
| visitor-payload | eyJyZWZlcnJlciI6IiIsInJlcXVlc3RfaWQiOiJFNDIyOjIxNUI5MjoyM0YwMDY5OjJGRDYwNUQ6NkIwMTk3NUQiLCJ2aXNpdG9yX2lkIjoiOTAzMTAwNDMzNjExMjYzNzc4OSIsInJlZ2lvbl9lZGdlIjoiaWFkIiwicmVnaW9uX3JlbmRlciI6ImlhZCJ9 |
| visitor-hmac | 50a141832c89f1794994d40b5bbf549f52b778d4a3ad7375fb7270d0abd0b48a |
| hovercard-subject-tag | repository:45646037 |
| github-keyboard-shortcuts | repository,issues,copilot |
| google-site-verification | Apib7-x98H0j5cPqHWwSMm6dNU4GmODRoqxLiDzdx9I |
| octolytics-url | https://collector.github.com/github/collect |
| analytics-location | / |
| fb:app_id | 1401488693436528 |
| apple-itunes-app | app-id=1477376905, app-argument=https://github.com/plotly/plotly.js/issues/2862 |
| twitter:image | https://opengraph.githubassets.com/57c90a5c507b7a2eb6579efb5bc579af0d74a853bc50c558b9dda8d7e24ca1dc/plotly/plotly.js |
| twitter:card | summary_large_image |
| og:image | https://opengraph.githubassets.com/57c90a5c507b7a2eb6579efb5bc579af0d74a853bc50c558b9dda8d7e24ca1dc/plotly/plotly.js |
| og:image:alt | Open-source JavaScript charting library behind Plotly and Dash - scatter3d.line.showscale doesn't show a colorscale · Issue #2862 · plotly/plotly.js |
| og:image:width | 1200 |
| og:image:height | 600 |
| og:site_name | GitHub |
| og:type | object |
| hostname | github.com |
| expected-hostname | github.com |
| None | cc5dfdd32f62ebd3223cab3af3aa2b268d3605218237326a48a99d1efd89495c |
| turbo-cache-control | no-cache |
| go-import | github.com/plotly/plotly.js git https://github.com/plotly/plotly.js.git |
| octolytics-dimension-user_id | 5997976 |
| octolytics-dimension-user_login | plotly |
| octolytics-dimension-repository_id | 45646037 |
| octolytics-dimension-repository_nwo | plotly/plotly.js |
| octolytics-dimension-repository_public | true |
| octolytics-dimension-repository_is_fork | false |
| octolytics-dimension-repository_network_root_id | 45646037 |
| octolytics-dimension-repository_network_root_nwo | plotly/plotly.js |
| turbo-body-classes | logged-out env-production page-responsive |
| disable-turbo | false |
| browser-stats-url | https://api.github.com/_private/browser/stats |
| browser-errors-url | https://api.github.com/_private/browser/errors |
| release | 8c77c9e8439031ad54c75a250694842892f693e1 |
| ui-target | full |
| theme-color | #1e2327 |
| color-scheme | light dark |
| react-app-name | issues |
Links:
Viewport: width=device-width
