Title: When using ggplotly() there can be duplication of legend items inconsistent with ggplot output · Issue #2043 · plotly/plotly.R · GitHub
Open Graph Title: When using ggplotly() there can be duplication of legend items inconsistent with ggplot output · Issue #2043 · plotly/plotly.R
X Title: When using ggplotly() there can be duplication of legend items inconsistent with ggplot output · Issue #2043 · plotly/plotly.R
Description: Thank you for this fantastic package -- I am amazed how well it works! When multiple geom_line() or geom_point() entries exist, the ggplotly() output can be different from the ggplot() output. What I've noticed is duplication of legend e...
Open Graph Description: Thank you for this fantastic package -- I am amazed how well it works! When multiple geom_line() or geom_point() entries exist, the ggplotly() output can be different from the ggplot() output. What...
X Description: Thank you for this fantastic package -- I am amazed how well it works! When multiple geom_line() or geom_point() entries exist, the ggplotly() output can be different from the ggplot() output. What...
Opengraph URL: https://github.com/plotly/plotly.R/issues/2043
X: @github
Domain: github.com
{"@context":"https://schema.org","@type":"DiscussionForumPosting","headline":"When using ggplotly() there can be duplication of legend items inconsistent with ggplot output","articleBody":"Thank you for this fantastic package -- I am amazed how well it works!\r\n\r\nWhen multiple `geom_line()` or `geom_point()` entries exist, the `ggplotly()` output can be different from the `ggplot()` output. What I've noticed is **duplication of legend entries** and sometimes ignoring of legend configuration options that ggplot provides.\r\n\r\nSeems possibly related to #572 & #2010 \r\n\r\n```r\r\ndf1 \u003c- data.frame(\r\n \"Date\" = seq(as.Date(\"2021-01-01\"), as.Date(\"2021-01-10\"), \"days\"),\r\n \"Series\" = c(rep(\"SeriesA\", 10), rep(\"SeriesB\",10)),\r\n \"Values\" = rnorm(n = 20),\r\n \"Mean\" = 0,\r\n \"V1\" = 2,\r\n \"V2\" = -2\r\n)\r\n\r\np \u003c- ggplot(df1, aes(x=Date, y=Values, color = Series, linetype = Series, shape = Series)) +\r\n geom_line(aes(x = Date, y = Mean, color = \"Mean\", linetype = \"Mean\")) +\r\n geom_line(aes(x = Date, y = V1, color = \"QC\", linetype = \"QC\")) +\r\n geom_line(aes(x = Date, y = V2, color = \"QC\", linetype = \"QC\")) +\r\n geom_line() + \r\n geom_point() + \r\n guides(shape=FALSE, linetype=FALSE)\r\n\r\nggplotly(p)\r\n```\r\n## ggplot() Output\r\n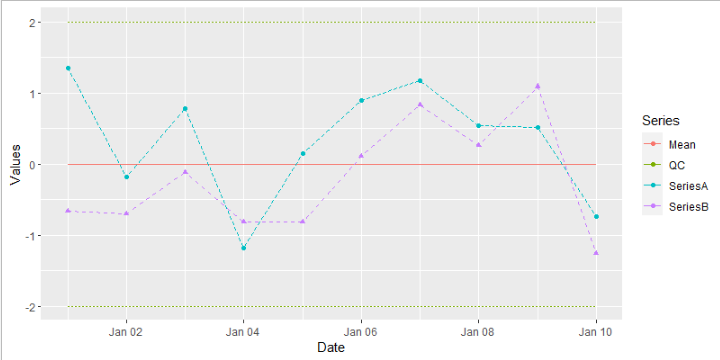\r\n\r\n## ggplotly() Output\r\n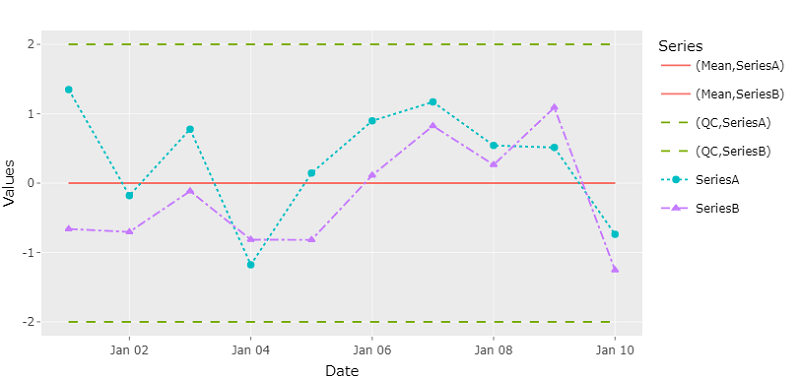\r\n\r\n\r\n","author":{"url":"https://github.com/wphampton","@type":"Person","name":"wphampton"},"datePublished":"2021-10-11T17:59:29Z","url":"https://github.com/plotly/plotly.R/issues/2043"}| react-profiling | 0 |
| react-import-map | react,react-dom,react-dom/client,react-dom/profiling,react-is,react/compiler-runtime,react/jsx-dev-runtime,react/jsx-runtime,scheduler@b8488ee2c322 |
| route-pattern | /_view_fragments/issues/show/:user_id/:repository/:id/issue_layout(.:format) |
| route-controller | voltron_issues_fragments |
| route-action | issue_layout |
| fetch-nonce | v2:3dafc7ca-6ea8-1ded-0815-9539d057c171 |
| current-catalog-service-hash | 81bb79d38c15960b92d99bca9288a9108c7a47b18f2423d0f6438c5b7bcd2114 |
| request-id | AED4:3D97C8:D571F5:11DB236:6B01005F |
| html-safe-nonce | f9a283cd87d7ed993c41dd7f3d7b96d9d102b13d5d83c17d2b8d98cdb5d9eb6a |
| visitor-payload | eyJyZWZlcnJlciI6IiIsInJlcXVlc3RfaWQiOiJBRUQ0OjNEOTdDODpENTcxRjU6MTFEQjIzNjo2QjAxMDA1RiIsInZpc2l0b3JfaWQiOiI0ODQ4Mzc5MTYzOTM5MjQyMDc5IiwicmVnaW9uX2VkZ2UiOiJpYWQiLCJyZWdpb25fcmVuZGVyIjoiaWFkIn0= |
| visitor-hmac | 9d1a294f6b50f8ccd19c47b9a14b672f16f49a42cc78580dee2280ac07bebcb9 |
| hovercard-subject-tag | issue:1022976589 |
| github-keyboard-shortcuts | repository,issues,copilot |
| google-site-verification | Apib7-x98H0j5cPqHWwSMm6dNU4GmODRoqxLiDzdx9I |
| octolytics-url | https://collector.github.com/github/collect |
| analytics-location | / |
| fb:app_id | 1401488693436528 |
| apple-itunes-app | app-id=1477376905, app-argument=https://github.com/_view_fragments/issues/show/plotly/plotly.R/2043/issue_layout |
| twitter:image | https://opengraph.githubassets.com/4dca4f887b74fb29394c912c8e5b3234191efa8ebd2ccbdf7d310a69c9da5047/plotly/plotly.R/issues/2043 |
| twitter:card | summary_large_image |
| og:image | https://opengraph.githubassets.com/4dca4f887b74fb29394c912c8e5b3234191efa8ebd2ccbdf7d310a69c9da5047/plotly/plotly.R/issues/2043 |
| og:image:alt | Thank you for this fantastic package -- I am amazed how well it works! When multiple geom_line() or geom_point() entries exist, the ggplotly() output can be different from the ggplot() output. What... |
| og:image:width | 1200 |
| og:image:height | 600 |
| og:site_name | GitHub |
| og:type | object |
| og:author:username | wphampton |
| hostname | github.com |
| expected-hostname | github.com |
| None | cb7fa109eca7d4156c889f474306b0e91336055e9adf8fd4684b61e49094d124 |
| turbo-cache-control | no-preview |
| go-import | github.com/plotly/plotly.R git https://github.com/plotly/plotly.R.git |
| octolytics-dimension-user_id | 5997976 |
| octolytics-dimension-user_login | plotly |
| octolytics-dimension-repository_id | 14579179 |
| octolytics-dimension-repository_nwo | plotly/plotly.R |
| octolytics-dimension-repository_public | true |
| octolytics-dimension-repository_is_fork | false |
| octolytics-dimension-repository_network_root_id | 14579179 |
| octolytics-dimension-repository_network_root_nwo | plotly/plotly.R |
| turbo-body-classes | logged-out env-production page-responsive |
| disable-turbo | false |
| browser-stats-url | https://api.github.com/_private/browser/stats |
| browser-errors-url | https://api.github.com/_private/browser/errors |
| release | 2b59d31a4e44f08b7af67a4b67f8fd0af3befe2a |
| ui-target | full |
| theme-color | #1e2327 |
| color-scheme | light dark |
| react-app-name | issues |
Links:
Viewport: width=device-width

