Title: Axis limits are set badly with small values in scatter(). · Issue #9979 · matplotlib/matplotlib · GitHub
Open Graph Title: Axis limits are set badly with small values in scatter(). · Issue #9979 · matplotlib/matplotlib
X Title: Axis limits are set badly with small values in scatter(). · Issue #9979 · matplotlib/matplotlib
Description: I'm not sure if this is related to #7413 Bug report Example: %pylab x = randn(1000) / 1e5 y = randn(1000) / 1e5 scatter(x, y) produces this: It should really produce something more like this: There's not an obvious way to do this, other ...
Open Graph Description: I'm not sure if this is related to #7413 Bug report Example: %pylab x = randn(1000) / 1e5 y = randn(1000) / 1e5 scatter(x, y) produces this: It should really produce something more like this: There...
X Description: I'm not sure if this is related to #7413 Bug report Example: %pylab x = randn(1000) / 1e5 y = randn(1000) / 1e5 scatter(x, y) produces this: It should really produce something more like this: T...
Opengraph URL: https://github.com/matplotlib/matplotlib/issues/9979
X: @github
Domain: github.com
{"@context":"https://schema.org","@type":"DiscussionForumPosting","headline":"Axis limits are set badly with small values in scatter().","articleBody":"I'm not sure if this is related to https://github.com/matplotlib/matplotlib/issues/7413\r\n\r\n\r\n### Bug report\r\n\r\nExample:\r\n\r\n```py\r\n%pylab\r\nx = randn(1000) / 1e5\r\ny = randn(1000) / 1e5\r\nscatter(x, y)\r\n```\r\nproduces this:\r\n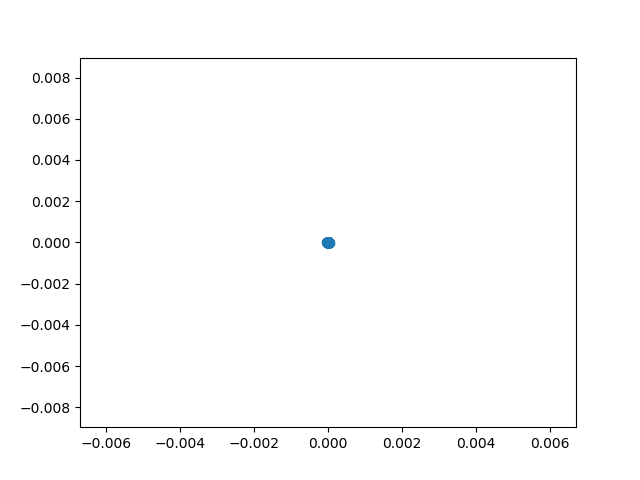\r\n\r\nIt should really produce something more like this:\r\n\r\n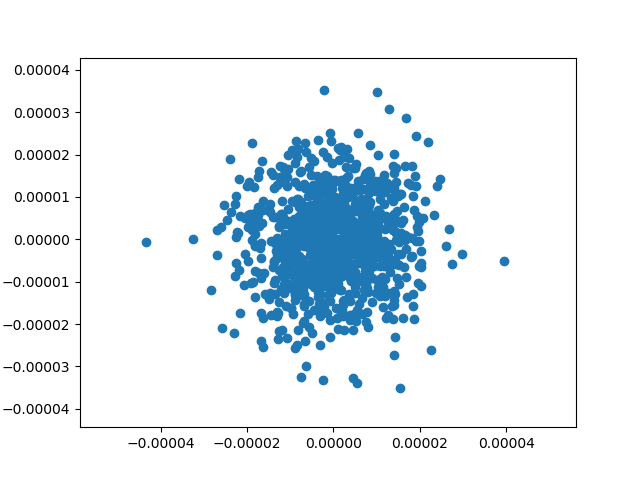\r\n\r\nThere's not an obvious way to do this, other than manually getting the min/max x and y values and adding a little bit and using `ax.set_x/ylim()`\r\n\r\nUsing conda on kubuntu:\r\n\r\n```\r\nmatplotlib 2.1.0 py36hba5de38_0 \r\npython 3.6.3 h0ef2715_3 \r\n```","author":{"url":"https://github.com/naught101","@type":"Person","name":"naught101"},"datePublished":"2017-12-12T05:05:48.000Z","interactionStatistic":{"@type":"InteractionCounter","interactionType":"https://schema.org/CommentAction","userInteractionCount":6},"url":"https://github.com/9979/matplotlib/issues/9979"}| route-pattern | /_view_fragments/issues/show/:user_id/:repository/:id/issue_layout(.:format) |
| route-controller | voltron_issues_fragments |
| route-action | issue_layout |
| fetch-nonce | v2:55c0d936-f5dc-e674-dd91-b1ec78621889 |
| current-catalog-service-hash | 81bb79d38c15960b92d99bca9288a9108c7a47b18f2423d0f6438c5b7bcd2114 |
| request-id | 9A16:4342D:1DDB96F:278C0AD:6A52D65B |
| html-safe-nonce | 8863157f21054d2d5b69fb00b7326ff89e0c94ce3bd2c77a38b12207c171c8f5 |
| visitor-payload | eyJyZWZlcnJlciI6IiIsInJlcXVlc3RfaWQiOiI5QTE2OjQzNDJEOjFEREI5NkY6Mjc4QzBBRDo2QTUyRDY1QiIsInZpc2l0b3JfaWQiOiIxNDQ0MjE0MjUwMDU4OTk1MjkxIiwicmVnaW9uX2VkZ2UiOiJpYWQiLCJyZWdpb25fcmVuZGVyIjoiaWFkIn0= |
| visitor-hmac | 10013c9bc5ea95446e7de8929b2a85fb2b7f4668200c19b8f74824ecf129e7b8 |
| hovercard-subject-tag | issue:281259442 |
| github-keyboard-shortcuts | repository,issues,copilot |
| google-site-verification | Apib7-x98H0j5cPqHWwSMm6dNU4GmODRoqxLiDzdx9I |
| octolytics-url | https://collector.github.com/github/collect |
| analytics-location | / |
| fb:app_id | 1401488693436528 |
| apple-itunes-app | app-id=1477376905, app-argument=https://github.com/_view_fragments/issues/show/matplotlib/matplotlib/9979/issue_layout |
| twitter:image | https://opengraph.githubassets.com/071a7e76d7dc3904a5442fb26fe3da83179171cf0d791450f9c93cdb6c2a0065/matplotlib/matplotlib/issues/9979 |
| twitter:card | summary_large_image |
| og:image | https://opengraph.githubassets.com/071a7e76d7dc3904a5442fb26fe3da83179171cf0d791450f9c93cdb6c2a0065/matplotlib/matplotlib/issues/9979 |
| og:image:alt | I'm not sure if this is related to #7413 Bug report Example: %pylab x = randn(1000) / 1e5 y = randn(1000) / 1e5 scatter(x, y) produces this: It should really produce something more like this: There... |
| og:image:width | 1200 |
| og:image:height | 600 |
| og:site_name | GitHub |
| og:type | object |
| og:author:username | naught101 |
| hostname | github.com |
| expected-hostname | github.com |
| None | b9a586c06a05a7a86fc7e3f4dbd03e42f6869085879aa184aa6369456dbd50fb |
| turbo-cache-control | no-preview |
| go-import | github.com/matplotlib/matplotlib git https://github.com/matplotlib/matplotlib.git |
| octolytics-dimension-user_id | 215947 |
| octolytics-dimension-user_login | matplotlib |
| octolytics-dimension-repository_id | 1385122 |
| octolytics-dimension-repository_nwo | matplotlib/matplotlib |
| octolytics-dimension-repository_public | true |
| octolytics-dimension-repository_is_fork | false |
| octolytics-dimension-repository_network_root_id | 1385122 |
| octolytics-dimension-repository_network_root_nwo | matplotlib/matplotlib |
| turbo-body-classes | logged-out env-production page-responsive |
| disable-turbo | false |
| browser-stats-url | https://api.github.com/_private/browser/stats |
| browser-errors-url | https://api.github.com/_private/browser/errors |
| release | 07a982c1d40157c619b364352b704c3ce66bb332 |
| ui-target | full |
| theme-color | #1e2327 |
| color-scheme | light dark |
Links:
Viewport: width=device-width

