Title: ax.fill_between broken for log scale and values below zero · Issue #9457 · matplotlib/matplotlib · GitHub
Open Graph Title: ax.fill_between broken for log scale and values below zero · Issue #9457 · matplotlib/matplotlib
X Title: ax.fill_between broken for log scale and values below zero · Issue #9457 · matplotlib/matplotlib
Description: ax.fill broken for log scale and values below zero When using ax.fill_between in log scale plots with y-values below zero, the result looks broken and areas are filled that should not be filled Code for reproduction import numpy as np im...
Open Graph Description: ax.fill broken for log scale and values below zero When using ax.fill_between in log scale plots with y-values below zero, the result looks broken and areas are filled that should not be filled Cod...
X Description: ax.fill broken for log scale and values below zero When using ax.fill_between in log scale plots with y-values below zero, the result looks broken and areas are filled that should not be filled Cod...
Opengraph URL: https://github.com/matplotlib/matplotlib/issues/9457
X: @github
Domain: github.com
{"@context":"https://schema.org","@type":"DiscussionForumPosting","headline":"ax.fill_between broken for log scale and values below zero","articleBody":"\r\n\r\n### ax.fill broken for log scale and values below zero\r\n\r\nWhen using ax.fill_between in log scale plots with y-values below zero, the result looks broken and areas are filled that should not be filled\r\n\r\n\r\n**Code for reproduction**\r\n\r\n\r\n```python\r\n\r\nimport numpy as np\r\nimport matplotlib.pyplot as plt\r\nxdata=np.arange(0,10,0.01)\r\nydata = np.exp(-xdata)\r\nedata = 0.2*(10-xdata)*np.cos(5*xdata)*np.exp(-xdata)\r\n\r\nfig, ax = plt.subplots()\r\nplt.yscale('log')\r\n\r\nax.fill_between(xdata, ydata - edata, ydata + edata)\r\n\r\nplt.savefig(\"test.png\")\r\n```\r\n\r\n**Actual outcome**\r\n\r\n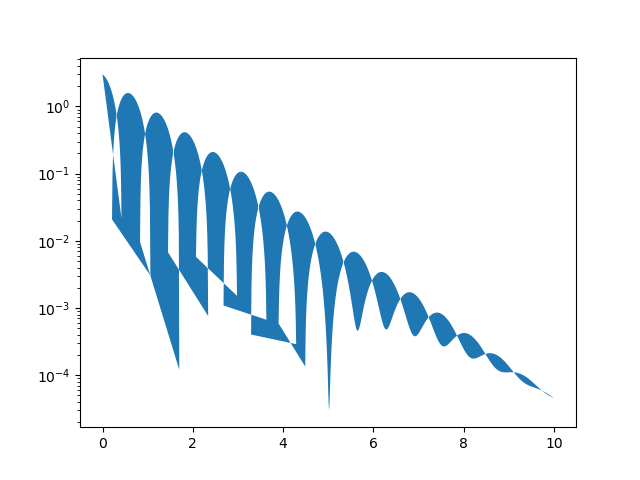\r\n\r\n**Expected outcome**\r\n\r\n\r\nThe correct example has been generated with matplotlib-2.0.2-1\r\n\r\n\r\nProbably related: #8623\r\nHow to deal with invalid values in log scale plots is certainly a matter of definition. However, it should never happen that areas are filled that should not be filled, as it is the case in the example above.\r\n\r\n**Matplotlib version**\r\n\r\n * Operating system: arch linux\r\n * Matplotlib version: 2.1.0-1\r\n * Matplotlib backend: Qt5Agg\r\n * Python version: 3.6.2\r\n * Other libraries: numpy version: 1.13.3-1\r\n\r\nEverything installed using the package manager of arch linux.\r\n","author":{"url":"https://github.com/hsandmeyer","@type":"Person","name":"hsandmeyer"},"datePublished":"2017-10-17T14:55:26.000Z","interactionStatistic":{"@type":"InteractionCounter","interactionType":"https://schema.org/CommentAction","userInteractionCount":2},"url":"https://github.com/9457/matplotlib/issues/9457"}| route-pattern | /_view_fragments/issues/show/:user_id/:repository/:id/issue_layout(.:format) |
| route-controller | voltron_issues_fragments |
| route-action | issue_layout |
| fetch-nonce | v2:d796c1ba-172b-1578-d94b-f6a0e6f92308 |
| current-catalog-service-hash | 81bb79d38c15960b92d99bca9288a9108c7a47b18f2423d0f6438c5b7bcd2114 |
| request-id | 89C0:1F816D:9D4EAE:D6B658:6A520114 |
| html-safe-nonce | 73f928106b7aeed747eda7b61457dd098adc5838c8efecbaa5d54a0413e5c9af |
| visitor-payload | eyJyZWZlcnJlciI6IiIsInJlcXVlc3RfaWQiOiI4OUMwOjFGODE2RDo5RDRFQUU6RDZCNjU4OjZBNTIwMTE0IiwidmlzaXRvcl9pZCI6Ijc0ODg4NzA5OTI0NjAyNTE0MTIiLCJyZWdpb25fZWRnZSI6ImlhZCIsInJlZ2lvbl9yZW5kZXIiOiJpYWQifQ== |
| visitor-hmac | 503d178d43e8d40a2e8006a36bcfb8e5232b64f28df1a6ae304c41f4e74feddc |
| hovercard-subject-tag | issue:266158094 |
| github-keyboard-shortcuts | repository,issues,copilot |
| google-site-verification | Apib7-x98H0j5cPqHWwSMm6dNU4GmODRoqxLiDzdx9I |
| octolytics-url | https://collector.github.com/github/collect |
| analytics-location | / |
| fb:app_id | 1401488693436528 |
| apple-itunes-app | app-id=1477376905, app-argument=https://github.com/_view_fragments/issues/show/matplotlib/matplotlib/9457/issue_layout |
| twitter:image | https://opengraph.githubassets.com/51d37c07c3b6d311ffd7a210bae2e04acab0473e85326fa3f614ccd3c96ef556/matplotlib/matplotlib/issues/9457 |
| twitter:card | summary_large_image |
| og:image | https://opengraph.githubassets.com/51d37c07c3b6d311ffd7a210bae2e04acab0473e85326fa3f614ccd3c96ef556/matplotlib/matplotlib/issues/9457 |
| og:image:alt | ax.fill broken for log scale and values below zero When using ax.fill_between in log scale plots with y-values below zero, the result looks broken and areas are filled that should not be filled Cod... |
| og:image:width | 1200 |
| og:image:height | 600 |
| og:site_name | GitHub |
| og:type | object |
| og:author:username | hsandmeyer |
| hostname | github.com |
| expected-hostname | github.com |
| None | b9a586c06a05a7a86fc7e3f4dbd03e42f6869085879aa184aa6369456dbd50fb |
| turbo-cache-control | no-preview |
| go-import | github.com/matplotlib/matplotlib git https://github.com/matplotlib/matplotlib.git |
| octolytics-dimension-user_id | 215947 |
| octolytics-dimension-user_login | matplotlib |
| octolytics-dimension-repository_id | 1385122 |
| octolytics-dimension-repository_nwo | matplotlib/matplotlib |
| octolytics-dimension-repository_public | true |
| octolytics-dimension-repository_is_fork | false |
| octolytics-dimension-repository_network_root_id | 1385122 |
| octolytics-dimension-repository_network_root_nwo | matplotlib/matplotlib |
| turbo-body-classes | logged-out env-production page-responsive |
| disable-turbo | false |
| browser-stats-url | https://api.github.com/_private/browser/stats |
| browser-errors-url | https://api.github.com/_private/browser/errors |
| release | 7aed05249554b889eb33d002851a973eebcc7e91 |
| ui-target | full |
| theme-color | #1e2327 |
| color-scheme | light dark |
Links:
Viewport: width=device-width

