Title: inset_locator.inset_axes produces axes without extent and at incorrect position. · Issue #8952 · matplotlib/matplotlib · GitHub
Open Graph Title: inset_locator.inset_axes produces axes without extent and at incorrect position. · Issue #8952 · matplotlib/matplotlib
X Title: inset_locator.inset_axes produces axes without extent and at incorrect position. · Issue #8952 · matplotlib/matplotlib
Description: The mpl_toolkits.axes_grid1.inset_locator.inset_axes is not working as expected when using the bbox_to_anchor argument. Using inset_axes(ax, width="70%", height="30%",bbox_to_anchor=(0.4,0.1), loc=3) gives an inset axes without extention...
Open Graph Description: The mpl_toolkits.axes_grid1.inset_locator.inset_axes is not working as expected when using the bbox_to_anchor argument. Using inset_axes(ax, width="70%", height="30%",bbox_to_anchor=(0.4,0.1), loc=...
X Description: The mpl_toolkits.axes_grid1.inset_locator.inset_axes is not working as expected when using the bbox_to_anchor argument. Using inset_axes(ax, width="70%", height="30%",bbox_to_an...
Opengraph URL: https://github.com/matplotlib/matplotlib/issues/8952
X: @github
Domain: github.com
{"@context":"https://schema.org","@type":"DiscussionForumPosting","headline":"inset_locator.inset_axes produces axes without extent and at incorrect position.","articleBody":"The `mpl_toolkits.axes_grid1.inset_locator.inset_axes` is not working as expected when using the `bbox_to_anchor` argument. Using `inset_axes(ax, width=\"70%\", height=\"30%\",bbox_to_anchor=(0.4,0.1), loc=3)` gives an inset axes without extention at an incorrect position. (This issue is raised in [this stackoverflow post](https://stackoverflow.com/questions/45378918/specific-location-for-inset-axes).)\r\n\r\nComplete example:\r\n```\r\nimport matplotlib.pyplot as plt\r\nfrom mpl_toolkits.axes_grid1.inset_locator import inset_axes\r\nplt.rcParams[\"figure.figsize\"] = 4,3\r\n\r\nfig, ax= plt.subplots()\r\n\r\niax =inset_axes(ax, width=\"70%\", height=\"30%\", bbox_to_anchor=(0.4,0.1), loc=3)\r\n\r\niax.plot([1,2,4])\r\nplt.show()\r\n\r\n```\r\n\r\ngives \r\n\r\n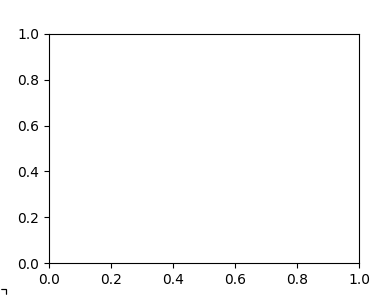\r\n\r\nand a warning\r\n\r\n``c:\\winpython\\winpython-64bit-2.7.10.3\\python-2.7.10.amd64\\lib\\site-packages\\matplotlib\\axis.py:1035: UserWarning: Unable to find pixel distance along axis for interval padding of ticks; assuming no interval padding needed.``\r\n\r\nwhen being run with python 2.7, matplotlib 2.0.2. In the lower left corner of the image you see what I suppose are the ticks of the zero-sized axes. Since the documentation clearly states that `width` and `height` can be strings (and they actually can be if `bbox_to_anchor` is ommited) and since the default `bbox_transform` is `parent_axes.transAxes`, the above is clearly expected to work.\r\n\r\nNote that when explicitely supplying the `bbox_transform` we at least get the axes at the correct position, \r\n\r\n```\r\niax =inset_axes(ax, width=\"70%\", height=\"30%\", bbox_to_anchor=(0.4,0.1), \r\n loc=3, bbox_transform=ax.transAxes)\r\n```\r\n\r\n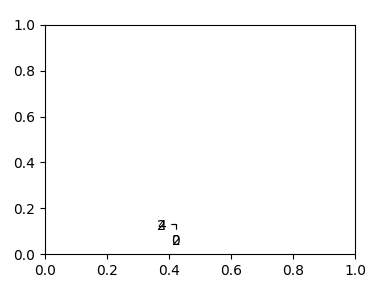\r\n\r\nwhile width and height are further ignored.\r\n\r\nIs this an error in the documentation or a bug in the matplotlib code?\r\n\r\nThe **expected outcome** of the above would be an inset axes with the lower left corner at (0.4,0.1) in axes coordinates and a width of 0.3 and a height of 0.7 (also in normalized axes units) as shown in the below image (which is produced by other means than `inset_axes`):\r\n\r\n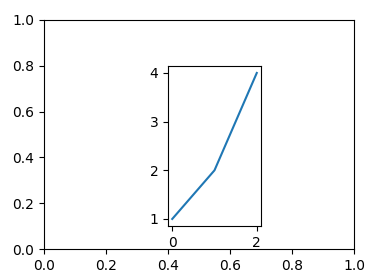\r\n\r\n","author":{"url":"https://github.com/ImportanceOfBeingErnest","@type":"Person","name":"ImportanceOfBeingErnest"},"datePublished":"2017-07-28T19:58:35.000Z","interactionStatistic":{"@type":"InteractionCounter","interactionType":"https://schema.org/CommentAction","userInteractionCount":4},"url":"https://github.com/8952/matplotlib/issues/8952"}| route-pattern | /_view_fragments/issues/show/:user_id/:repository/:id/issue_layout(.:format) |
| route-controller | voltron_issues_fragments |
| route-action | issue_layout |
| fetch-nonce | v2:f84558d5-2ba9-9d9d-1d3e-c76d21bcbd89 |
| current-catalog-service-hash | 81bb79d38c15960b92d99bca9288a9108c7a47b18f2423d0f6438c5b7bcd2114 |
| request-id | EA48:15F1A6:8E122:B8DCB:6A52E9FE |
| html-safe-nonce | 862d0af5e35ad21b6c5f537897971d2069b6e435d5c3924c6aeae7557275a43d |
| visitor-payload | eyJyZWZlcnJlciI6IiIsInJlcXVlc3RfaWQiOiJFQTQ4OjE1RjFBNjo4RTEyMjpCOERDQjo2QTUyRTlGRSIsInZpc2l0b3JfaWQiOiIxODA3Njk2NDkwNTA1ODkwMzAyIiwicmVnaW9uX2VkZ2UiOiJpYWQiLCJyZWdpb25fcmVuZGVyIjoiaWFkIn0= |
| visitor-hmac | bae7d1f76db793c34642db2ab32e431364465c4a04ccd871d0736b8e6d79c916 |
| hovercard-subject-tag | issue:246444877 |
| github-keyboard-shortcuts | repository,issues,copilot |
| google-site-verification | Apib7-x98H0j5cPqHWwSMm6dNU4GmODRoqxLiDzdx9I |
| octolytics-url | https://collector.github.com/github/collect |
| analytics-location | / |
| fb:app_id | 1401488693436528 |
| apple-itunes-app | app-id=1477376905, app-argument=https://github.com/_view_fragments/issues/show/matplotlib/matplotlib/8952/issue_layout |
| twitter:image | https://opengraph.githubassets.com/2e10624a26eb0a080b9ba468433970910c666d405aaf1e2ee9ba4c1cedbcdcd2/matplotlib/matplotlib/issues/8952 |
| twitter:card | summary_large_image |
| og:image | https://opengraph.githubassets.com/2e10624a26eb0a080b9ba468433970910c666d405aaf1e2ee9ba4c1cedbcdcd2/matplotlib/matplotlib/issues/8952 |
| og:image:alt | The mpl_toolkits.axes_grid1.inset_locator.inset_axes is not working as expected when using the bbox_to_anchor argument. Using inset_axes(ax, width="70%", height="30%",bbox_to_anchor=(0.4,0.1), loc=... |
| og:image:width | 1200 |
| og:image:height | 600 |
| og:site_name | GitHub |
| og:type | object |
| og:author:username | ImportanceOfBeingErnest |
| hostname | github.com |
| expected-hostname | github.com |
| None | b9a586c06a05a7a86fc7e3f4dbd03e42f6869085879aa184aa6369456dbd50fb |
| turbo-cache-control | no-preview |
| go-import | github.com/matplotlib/matplotlib git https://github.com/matplotlib/matplotlib.git |
| octolytics-dimension-user_id | 215947 |
| octolytics-dimension-user_login | matplotlib |
| octolytics-dimension-repository_id | 1385122 |
| octolytics-dimension-repository_nwo | matplotlib/matplotlib |
| octolytics-dimension-repository_public | true |
| octolytics-dimension-repository_is_fork | false |
| octolytics-dimension-repository_network_root_id | 1385122 |
| octolytics-dimension-repository_network_root_nwo | matplotlib/matplotlib |
| turbo-body-classes | logged-out env-production page-responsive |
| disable-turbo | false |
| browser-stats-url | https://api.github.com/_private/browser/stats |
| browser-errors-url | https://api.github.com/_private/browser/errors |
| release | 07a982c1d40157c619b364352b704c3ce66bb332 |
| ui-target | full |
| theme-color | #1e2327 |
| color-scheme | light dark |
Links:
Viewport: width=device-width


