Title: Weird behavior with pint.Quantity + masked array · Issue #8908 · matplotlib/matplotlib · GitHub
Open Graph Title: Weird behavior with pint.Quantity + masked array · Issue #8908 · matplotlib/matplotlib
X Title: Weird behavior with pint.Quantity + masked array · Issue #8908 · matplotlib/matplotlib
Description: From my SciPy 2017 talk, the combination of pint.Quantity for unit support with masked arrays produces problems not seen with either individually: %matplotlib inline import matplotlib.pyplot as plt import numpy as np import pint units = ...
Open Graph Description: From my SciPy 2017 talk, the combination of pint.Quantity for unit support with masked arrays produces problems not seen with either individually: %matplotlib inline import matplotlib.pyplot as plt...
X Description: From my SciPy 2017 talk, the combination of pint.Quantity for unit support with masked arrays produces problems not seen with either individually: %matplotlib inline import matplotlib.pyplot as plt...
Opengraph URL: https://github.com/matplotlib/matplotlib/issues/8908
X: @github
Domain: github.com
{"@context":"https://schema.org","@type":"DiscussionForumPosting","headline":"Weird behavior with pint.Quantity + masked array","articleBody":"From my SciPy 2017 talk, the combination of pint.Quantity for unit support with masked arrays produces problems not seen with either individually:\r\n\r\n```python\r\n%matplotlib inline\r\n\r\nimport matplotlib.pyplot as plt\r\nimport numpy as np\r\nimport pint\r\n\r\nunits = pint.UnitRegistry()\r\n\r\ndata = np.random.randn(30,)\r\ndata_units = data * units.meters\r\ndata_masked = np.ma.array(data, mask=data\u003c0.)\r\ndata_masked_units = data_masked * units.meters\r\n\r\nfig, axes = plt.subplots(1, 3, sharex=True, sharey=True, figsize=(8, 4))\r\naxes[0].plot(data_units)\r\naxes[1].plot(data_masked)\r\naxes[2].plot(data_masked_units)\r\n```\r\n\r\nproduces:\r\n\r\n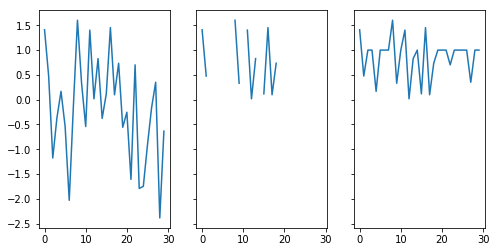\r\n","author":{"url":"https://github.com/dopplershift","@type":"Person","name":"dopplershift"},"datePublished":"2017-07-18T21:59:49.000Z","interactionStatistic":{"@type":"InteractionCounter","interactionType":"https://schema.org/CommentAction","userInteractionCount":3},"url":"https://github.com/8908/matplotlib/issues/8908"}| route-pattern | /_view_fragments/issues/show/:user_id/:repository/:id/issue_layout(.:format) |
| route-controller | voltron_issues_fragments |
| route-action | issue_layout |
| fetch-nonce | v2:193f6c57-9eca-ec18-42bc-491cc57dbbcb |
| current-catalog-service-hash | 81bb79d38c15960b92d99bca9288a9108c7a47b18f2423d0f6438c5b7bcd2114 |
| request-id | 836E:2818E8:1B9CAB8:24DEFD4:6A52D635 |
| html-safe-nonce | 6f23a39f2948da53594f3eea009d44249f3e669a76f5ff9176c530daabb48bc0 |
| visitor-payload | eyJyZWZlcnJlciI6IiIsInJlcXVlc3RfaWQiOiI4MzZFOjI4MThFODoxQjlDQUI4OjI0REVGRDQ6NkE1MkQ2MzUiLCJ2aXNpdG9yX2lkIjoiNzIwNDM0Mjc0MDY3ODc5Mjc1NyIsInJlZ2lvbl9lZGdlIjoiaWFkIiwicmVnaW9uX3JlbmRlciI6ImlhZCJ9 |
| visitor-hmac | 2e79929347a055ac274977a6587c8926e4e71f1dc046cb5ca9904ef940519bb6 |
| hovercard-subject-tag | issue:243864480 |
| github-keyboard-shortcuts | repository,issues,copilot |
| google-site-verification | Apib7-x98H0j5cPqHWwSMm6dNU4GmODRoqxLiDzdx9I |
| octolytics-url | https://collector.github.com/github/collect |
| analytics-location | / |
| fb:app_id | 1401488693436528 |
| apple-itunes-app | app-id=1477376905, app-argument=https://github.com/_view_fragments/issues/show/matplotlib/matplotlib/8908/issue_layout |
| twitter:image | https://opengraph.githubassets.com/884624a89fadb6068ae6db9d391148d75a37b833040f4051200cf60e5a68510f/matplotlib/matplotlib/issues/8908 |
| twitter:card | summary_large_image |
| og:image | https://opengraph.githubassets.com/884624a89fadb6068ae6db9d391148d75a37b833040f4051200cf60e5a68510f/matplotlib/matplotlib/issues/8908 |
| og:image:alt | From my SciPy 2017 talk, the combination of pint.Quantity for unit support with masked arrays produces problems not seen with either individually: %matplotlib inline import matplotlib.pyplot as plt... |
| og:image:width | 1200 |
| og:image:height | 600 |
| og:site_name | GitHub |
| og:type | object |
| og:author:username | dopplershift |
| hostname | github.com |
| expected-hostname | github.com |
| None | b9a586c06a05a7a86fc7e3f4dbd03e42f6869085879aa184aa6369456dbd50fb |
| turbo-cache-control | no-preview |
| go-import | github.com/matplotlib/matplotlib git https://github.com/matplotlib/matplotlib.git |
| octolytics-dimension-user_id | 215947 |
| octolytics-dimension-user_login | matplotlib |
| octolytics-dimension-repository_id | 1385122 |
| octolytics-dimension-repository_nwo | matplotlib/matplotlib |
| octolytics-dimension-repository_public | true |
| octolytics-dimension-repository_is_fork | false |
| octolytics-dimension-repository_network_root_id | 1385122 |
| octolytics-dimension-repository_network_root_nwo | matplotlib/matplotlib |
| turbo-body-classes | logged-out env-production page-responsive |
| disable-turbo | false |
| browser-stats-url | https://api.github.com/_private/browser/stats |
| browser-errors-url | https://api.github.com/_private/browser/errors |
| release | 07a982c1d40157c619b364352b704c3ce66bb332 |
| ui-target | canary-1 |
| theme-color | #1e2327 |
| color-scheme | light dark |
Links:
Viewport: width=device-width
