Title: some problem in eps file · Issue #8901 · matplotlib/matplotlib · GitHub
Open Graph Title: some problem in eps file · Issue #8901 · matplotlib/matplotlib
X Title: some problem in eps file · Issue #8901 · matplotlib/matplotlib
Description: I think that is a matplotlib characteristic, when one draw a plot import numpy as np import matplotlib.pyplot as plt x = np.linspace(0, 10, 500) dashes = [10, 5, 100, 5] # 10 points on, 5 off, 100 on, 5 off fig, ax = plt.subplots() line1...
Open Graph Description: I think that is a matplotlib characteristic, when one draw a plot import numpy as np import matplotlib.pyplot as plt x = np.linspace(0, 10, 500) dashes = [10, 5, 100, 5] # 10 points on, 5 off, 100 ...
X Description: I think that is a matplotlib characteristic, when one draw a plot import numpy as np import matplotlib.pyplot as plt x = np.linspace(0, 10, 500) dashes = [10, 5, 100, 5] # 10 points on, 5 off, 100 ...
Opengraph URL: https://github.com/matplotlib/matplotlib/issues/8901
X: @github
Domain: github.com
{"@context":"https://schema.org","@type":"DiscussionForumPosting","headline":"some problem in eps file","articleBody":"I think that is a matplotlib characteristic, when one draw a plot\r\n\r\n```python\r\nimport numpy as np\r\nimport matplotlib.pyplot as plt\r\nx = np.linspace(0, 10, 500)\r\ndashes = [10, 5, 100, 5] # 10 points on, 5 off, 100 on, 5 off\r\nfig, ax = plt.subplots()\r\nline1, = ax.plot(x, np.sin(x), '--', linewidth=2,\r\n label='Dashes set retroactively')\r\nline1.set_dashes(dashes)\r\nline2, = ax.plot(x, -1 * np.sin(x), dashes=[30, 5, 10, 5],\r\n label='Dashes set proactively')\r\nplt.xlim(1, 9)\r\nax.legend(loc='lower right')\r\nplt.savefig('test1.eps', dpi=1000)\r\n```\r\n\r\nset the xlim will force the X-axis within 1-9, the line segment outside 1-9 hide, but it just hide not be clipped, **I don't know how can i actually clip elements with axes extent.**\r\n\r\nI use Adobe Illustrator to open eps file. \r\nYou see it is fine,\r\n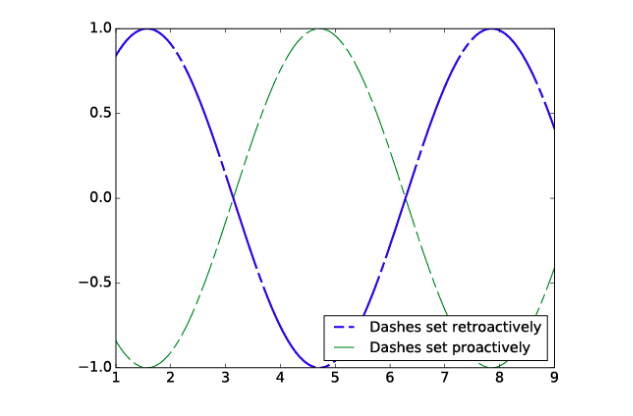\r\nBut actually it is,\r\n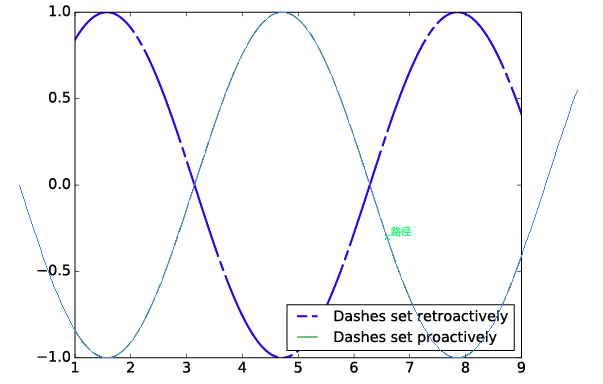\r\n\r\nIn sometimes, this characteristic is very useful, for example, if one use `plt.show()` to use the interactive mode, one can drag the canvas to left or to right to see the whole line in the range 0-10.\r\n\r\nBut in eps file, i do not think this characteristic reasonably, it typically increases the eps file size.\r\n**Is it a method to change this behavior ?**\r\n\r\nMatplotlib: `1.5.X` or `2.0.X`\r\nOS: `Windows 10` or `CentOS`\r\n","author":{"url":"https://github.com/wqshen","@type":"Person","name":"wqshen"},"datePublished":"2017-07-17T00:32:43.000Z","interactionStatistic":{"@type":"InteractionCounter","interactionType":"https://schema.org/CommentAction","userInteractionCount":6},"url":"https://github.com/8901/matplotlib/issues/8901"}| route-pattern | /_view_fragments/issues/show/:user_id/:repository/:id/issue_layout(.:format) |
| route-controller | voltron_issues_fragments |
| route-action | issue_layout |
| fetch-nonce | v2:b9b1357d-7c72-518b-cf04-15555e6c3e2d |
| current-catalog-service-hash | 81bb79d38c15960b92d99bca9288a9108c7a47b18f2423d0f6438c5b7bcd2114 |
| request-id | D100:15C29F:1CA151:26E9EB:6A51860B |
| html-safe-nonce | a1dfb6a060587735aea4b5c730ff45190be0beef1ef950dc023c480fa3d4cd76 |
| visitor-payload | eyJyZWZlcnJlciI6IiIsInJlcXVlc3RfaWQiOiJEMTAwOjE1QzI5RjoxQ0ExNTE6MjZFOUVCOjZBNTE4NjBCIiwidmlzaXRvcl9pZCI6IjI3MTg4NzYzMjc3OTI5NjkyMjciLCJyZWdpb25fZWRnZSI6ImlhZCIsInJlZ2lvbl9yZW5kZXIiOiJpYWQifQ== |
| visitor-hmac | 2b82d797496331281425923d498594d100c19c458b54ddc15de51a852158c969 |
| hovercard-subject-tag | issue:243277728 |
| github-keyboard-shortcuts | repository,issues,copilot |
| google-site-verification | Apib7-x98H0j5cPqHWwSMm6dNU4GmODRoqxLiDzdx9I |
| octolytics-url | https://collector.github.com/github/collect |
| analytics-location | / |
| fb:app_id | 1401488693436528 |
| apple-itunes-app | app-id=1477376905, app-argument=https://github.com/_view_fragments/issues/show/matplotlib/matplotlib/8901/issue_layout |
| twitter:image | https://opengraph.githubassets.com/86d185bfe54ba50c619a63da86d6c1883d217277c87a88efc1078ca9b3537cf5/matplotlib/matplotlib/issues/8901 |
| twitter:card | summary_large_image |
| og:image | https://opengraph.githubassets.com/86d185bfe54ba50c619a63da86d6c1883d217277c87a88efc1078ca9b3537cf5/matplotlib/matplotlib/issues/8901 |
| og:image:alt | I think that is a matplotlib characteristic, when one draw a plot import numpy as np import matplotlib.pyplot as plt x = np.linspace(0, 10, 500) dashes = [10, 5, 100, 5] # 10 points on, 5 off, 100 ... |
| og:image:width | 1200 |
| og:image:height | 600 |
| og:site_name | GitHub |
| og:type | object |
| og:author:username | wqshen |
| hostname | github.com |
| expected-hostname | github.com |
| None | b9a586c06a05a7a86fc7e3f4dbd03e42f6869085879aa184aa6369456dbd50fb |
| turbo-cache-control | no-preview |
| go-import | github.com/matplotlib/matplotlib git https://github.com/matplotlib/matplotlib.git |
| octolytics-dimension-user_id | 215947 |
| octolytics-dimension-user_login | matplotlib |
| octolytics-dimension-repository_id | 1385122 |
| octolytics-dimension-repository_nwo | matplotlib/matplotlib |
| octolytics-dimension-repository_public | true |
| octolytics-dimension-repository_is_fork | false |
| octolytics-dimension-repository_network_root_id | 1385122 |
| octolytics-dimension-repository_network_root_nwo | matplotlib/matplotlib |
| turbo-body-classes | logged-out env-production page-responsive |
| disable-turbo | false |
| browser-stats-url | https://api.github.com/_private/browser/stats |
| browser-errors-url | https://api.github.com/_private/browser/errors |
| release | cb77a7b8b06cd86c243be33fd8e7922d70a9d243 |
| ui-target | full |
| theme-color | #1e2327 |
| color-scheme | light dark |
Links:
Viewport: width=device-width

