Title: Agg alpha image compositor differs from Matplotlib's software image compositor · Issue #8847 · matplotlib/matplotlib · GitHub
Open Graph Title: Agg alpha image compositor differs from Matplotlib's software image compositor · Issue #8847 · matplotlib/matplotlib
X Title: Agg alpha image compositor differs from Matplotlib's software image compositor · Issue #8847 · matplotlib/matplotlib
Description: On master. The following test is taken from test_images.test_image_composite_alpha: from pylab import * fig = plt.figure() ax = fig.add_subplot(111) arr = np.zeros((11, 21, 4)) arr[:, :, 0] = 1 arr[:, :, 3] = np.concatenate((np.arange(0,...
Open Graph Description: On master. The following test is taken from test_images.test_image_composite_alpha: from pylab import * fig = plt.figure() ax = fig.add_subplot(111) arr = np.zeros((11, 21, 4)) arr[:, :, 0] = 1 arr...
X Description: On master. The following test is taken from test_images.test_image_composite_alpha: from pylab import * fig = plt.figure() ax = fig.add_subplot(111) arr = np.zeros((11, 21, 4)) arr[:, :, 0] = 1 arr...
Opengraph URL: https://github.com/matplotlib/matplotlib/issues/8847
X: @github
Domain: github.com
{"@context":"https://schema.org","@type":"DiscussionForumPosting","headline":"Agg alpha image compositor differs from Matplotlib's software image compositor","articleBody":"On master.\r\n\r\nThe following test is taken from test_images.test_image_composite_alpha:\r\n```\r\nfrom pylab import *\r\n\r\nfig = plt.figure()\r\nax = fig.add_subplot(111)\r\narr = np.zeros((11, 21, 4))\r\narr[:, :, 0] = 1\r\narr[:, :, 3] = np.concatenate((np.arange(0, 1.1, 0.1), np.arange(0, 1, 0.1)[::-1]))\r\narr2 = np.zeros((21, 11, 4))\r\narr2[:, :, 0] = 1\r\narr2[:, :, 1] = 1\r\narr2[:, :, 3] = np.concatenate((np.arange(0, 1.1, 0.1), np.arange(0, 1, 0.1)[::-1]))[:, np.newaxis]\r\nax.imshow(arr, extent=[1, 2, 5, 0], alpha=0.3)\r\nax.imshow(arr, extent=[2, 3, 5, 0], alpha=0.6)\r\nax.imshow(arr, extent=[3, 4, 5, 0])\r\nax.imshow(arr2, extent=[0, 5, 1, 2])\r\nax.imshow(arr2, extent=[0, 5, 2, 3], alpha=0.6)\r\nax.imshow(arr2, extent=[0, 5, 3, 4], alpha=0.3)\r\nax.set_facecolor((0, 0.5, 0, 1))\r\nax.set_xlim([0, 5])\r\nax.set_ylim([5, 0])\r\n\r\nshow()\r\n```\r\nBy default, Agg produces the following result:\r\n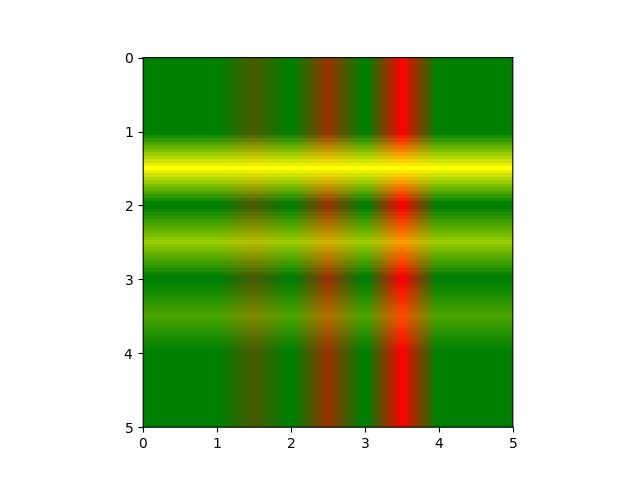\r\n\r\nMatplotlib can also force software composition of overlapping images, which is, I guess, faster for vector backends (only one image ends up written to the file). For Agg, this is disabled; the Agg renderer does the compositing itself. But you can switch Agg back to use software composition with the following patch:\r\n```\r\ndiff --git a/lib/matplotlib/backends/backend_agg.py b/lib/matplotlib/backends/backend_agg.py\r\nindex c6af41b19..580cf0cf8 100644\r\n--- a/lib/matplotlib/backends/backend_agg.py\r\n+++ b/lib/matplotlib/backends/backend_agg.py\r\n@@ -302,7 +302,7 @@ class RendererAgg(RendererBase):\r\n # It is generally faster to composite each image directly to\r\n # the Figure, and there's no file size benefit to compositing\r\n # with the Agg backend\r\n- return True\r\n+ return False\r\n \r\n def option_scale_image(self):\r\n \"\"\"\r\n```\r\nWith the patch on, the result is clearly different.\r\n\r\n\r\nI haven't looked much into which one is correct (it should be easy to manually compute the result), although https://github.com/anntzer/mpl_cairo seems to agree visually with Matplotlib, not Agg.\r\n","author":{"url":"https://github.com/anntzer","@type":"Person","name":"anntzer"},"datePublished":"2017-07-08T01:54:15.000Z","interactionStatistic":{"@type":"InteractionCounter","interactionType":"https://schema.org/CommentAction","userInteractionCount":3},"url":"https://github.com/8847/matplotlib/issues/8847"}| route-pattern | /_view_fragments/issues/show/:user_id/:repository/:id/issue_layout(.:format) |
| route-controller | voltron_issues_fragments |
| route-action | issue_layout |
| fetch-nonce | v2:c8118230-5197-4a2b-957d-5f38f454d97f |
| current-catalog-service-hash | 81bb79d38c15960b92d99bca9288a9108c7a47b18f2423d0f6438c5b7bcd2114 |
| request-id | D53A:2A1FE2:A36AB8:DBF82A:6A53143A |
| html-safe-nonce | 6e798ff27675fae866422f415cab07daac5c4d124ae365f92d2c540c74a2b3b1 |
| visitor-payload | eyJyZWZlcnJlciI6IiIsInJlcXVlc3RfaWQiOiJENTNBOjJBMUZFMjpBMzZBQjg6REJGODJBOjZBNTMxNDNBIiwidmlzaXRvcl9pZCI6IjI2MDMxNDI1MDI2NTI1MTUzODYiLCJyZWdpb25fZWRnZSI6ImlhZCIsInJlZ2lvbl9yZW5kZXIiOiJpYWQifQ== |
| visitor-hmac | 4538bee58bfd757edbe1915b7edb01c8ead3a7a7dffd1f383d4c8acf228a4667 |
| hovercard-subject-tag | issue:241416745 |
| github-keyboard-shortcuts | repository,issues,copilot |
| google-site-verification | Apib7-x98H0j5cPqHWwSMm6dNU4GmODRoqxLiDzdx9I |
| octolytics-url | https://collector.github.com/github/collect |
| analytics-location | / |
| fb:app_id | 1401488693436528 |
| apple-itunes-app | app-id=1477376905, app-argument=https://github.com/_view_fragments/issues/show/matplotlib/matplotlib/8847/issue_layout |
| twitter:image | https://opengraph.githubassets.com/825ba9a133ac1d0fff617cf104303b22aa7ab698e22355e336db1d7bee865e6a/matplotlib/matplotlib/issues/8847 |
| twitter:card | summary_large_image |
| og:image | https://opengraph.githubassets.com/825ba9a133ac1d0fff617cf104303b22aa7ab698e22355e336db1d7bee865e6a/matplotlib/matplotlib/issues/8847 |
| og:image:alt | On master. The following test is taken from test_images.test_image_composite_alpha: from pylab import * fig = plt.figure() ax = fig.add_subplot(111) arr = np.zeros((11, 21, 4)) arr[:, :, 0] = 1 arr... |
| og:image:width | 1200 |
| og:image:height | 600 |
| og:site_name | GitHub |
| og:type | object |
| og:author:username | anntzer |
| hostname | github.com |
| expected-hostname | github.com |
| None | b9a586c06a05a7a86fc7e3f4dbd03e42f6869085879aa184aa6369456dbd50fb |
| turbo-cache-control | no-preview |
| go-import | github.com/matplotlib/matplotlib git https://github.com/matplotlib/matplotlib.git |
| octolytics-dimension-user_id | 215947 |
| octolytics-dimension-user_login | matplotlib |
| octolytics-dimension-repository_id | 1385122 |
| octolytics-dimension-repository_nwo | matplotlib/matplotlib |
| octolytics-dimension-repository_public | true |
| octolytics-dimension-repository_is_fork | false |
| octolytics-dimension-repository_network_root_id | 1385122 |
| octolytics-dimension-repository_network_root_nwo | matplotlib/matplotlib |
| turbo-body-classes | logged-out env-production page-responsive |
| disable-turbo | false |
| browser-stats-url | https://api.github.com/_private/browser/stats |
| browser-errors-url | https://api.github.com/_private/browser/errors |
| release | 07a982c1d40157c619b364352b704c3ce66bb332 |
| ui-target | full |
| theme-color | #1e2327 |
| color-scheme | light dark |
Links:
Viewport: width=device-width

