Title: colorbar might shrink plots if used with twinx · Issue #8823 · matplotlib/matplotlib · GitHub
Open Graph Title: colorbar might shrink plots if used with twinx · Issue #8823 · matplotlib/matplotlib
X Title: colorbar might shrink plots if used with twinx · Issue #8823 · matplotlib/matplotlib
Description: Bug report Changing plot alignment for different placing of colorbar() in twinx plot If one combines a pcolormesh plot/hist2d plot with a standard plot by using twinx, the graph from the plot moves to wrong x values if the colorbar is ca...
Open Graph Description: Bug report Changing plot alignment for different placing of colorbar() in twinx plot If one combines a pcolormesh plot/hist2d plot with a standard plot by using twinx, the graph from the plot moves...
X Description: Bug report Changing plot alignment for different placing of colorbar() in twinx plot If one combines a pcolormesh plot/hist2d plot with a standard plot by using twinx, the graph from the plot moves...
Opengraph URL: https://github.com/matplotlib/matplotlib/issues/8823
X: @github
Domain: github.com
{"@context":"https://schema.org","@type":"DiscussionForumPosting","headline":"colorbar might shrink plots if used with twinx","articleBody":"### Bug report\r\n\r\n**Changing plot alignment for different placing of colorbar() in twinx plot**\r\n\r\nIf one combines a `pcolormesh` plot/`hist2d` plot with a standard `plot` by using `twinx`, the graph from the `plot` moves to wrong x values if the colorbar is called after the `plot` call. If it is called before, the alignment is fine. \r\n\r\nI am not sure if this is a bug or just wrong usage. \r\nHowever, one of the resulting graphs has a wrong extent that might lead to misinterpretations. \r\n\r\n**Code for reproduction**\r\n\r\n```python\r\nimport numpy as np\r\nimport matplotlib.pyplot as plt\r\n\r\ndata = np.random.random((64, 128)) * 2.0\r\nx = np.arange(128)\r\ny = np.arange(64)\r\nplt.pcolormesh(x, y, data)\r\n\r\n#plt.colorbar() --\u003e here it works fine\r\nplt.twinx()\r\nplt.colorbar()\r\n# --\u003e here it gives wrong x values for the orange plot\r\n\r\nplt.plot(x, np.sin(x/10), color=\"orange\", lw=4)\r\n\r\nplt.show()\r\n```\r\n\r\n**Actual outcome**\r\n\r\n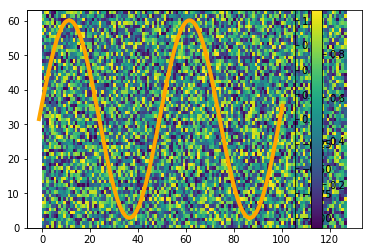\r\n\r\nNext to the confusing layout the plot shows actually a wrong graph:\r\nthe **orange plot** just goes to around x=100 but **should go to x=128**.\r\n(The axis of the colorbar is correct and shows the range of `data`.)\r\n\r\n\r\n\r\n\r\n**Expected outcome**\r\n\r\n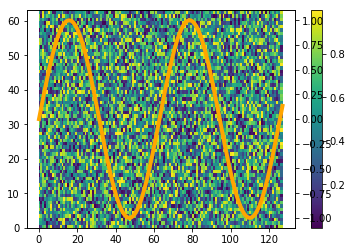\r\n\r\nIf `colorbar` is called before `twinx`, the orange graph has the correct extent. \r\n\r\n*I am not sure if this is a bug or a wrong usage of matplotlib. In any case the wrong extent of the (in this case) orange plot is a dangerous behavior that might lead to misinterpretations of the data.*\r\n\r\n**Matplotlib version**\r\n\r\n * Operating System: Ubuntu 14.04.1\r\n * Matplotlib Version: 2.0.0rc1\r\n * Python Version: 3.4.3\r\n * Jupyter Version: 1.0.0 (I am using `%matplotlib inline`)\r\n * Other Libraries: numpy 1.12.0b1\r\n\r\nI installed matplotlib via pip.\r\n\r\n\r\n","author":{"url":"https://github.com/PrometheusPi","@type":"Person","name":"PrometheusPi"},"datePublished":"2017-06-29T16:29:02.000Z","interactionStatistic":{"@type":"InteractionCounter","interactionType":"https://schema.org/CommentAction","userInteractionCount":7},"url":"https://github.com/8823/matplotlib/issues/8823"}| route-pattern | /_view_fragments/issues/show/:user_id/:repository/:id/issue_layout(.:format) |
| route-controller | voltron_issues_fragments |
| route-action | issue_layout |
| fetch-nonce | v2:75405697-6e88-5c1e-3699-965841d37488 |
| current-catalog-service-hash | 81bb79d38c15960b92d99bca9288a9108c7a47b18f2423d0f6438c5b7bcd2114 |
| request-id | D6C6:B6D9A:13F1E2D:1AA76DA:6A52ABED |
| html-safe-nonce | 1c0c32a9d95d06492f3df953b785e7a3bc492799a07def0c4a9cf14ce9a3d75e |
| visitor-payload | eyJyZWZlcnJlciI6IiIsInJlcXVlc3RfaWQiOiJENkM2OkI2RDlBOjEzRjFFMkQ6MUFBNzZEQTo2QTUyQUJFRCIsInZpc2l0b3JfaWQiOiI4MTg3NTI3MDI2MDc4NTU5MjEzIiwicmVnaW9uX2VkZ2UiOiJpYWQiLCJyZWdpb25fcmVuZGVyIjoiaWFkIn0= |
| visitor-hmac | 6e811887e9ce1930204c9270dbc977a35c5d8fb89bb7a3ace5569f0726cc0005 |
| hovercard-subject-tag | issue:239537061 |
| github-keyboard-shortcuts | repository,issues,copilot |
| google-site-verification | Apib7-x98H0j5cPqHWwSMm6dNU4GmODRoqxLiDzdx9I |
| octolytics-url | https://collector.github.com/github/collect |
| analytics-location | / |
| fb:app_id | 1401488693436528 |
| apple-itunes-app | app-id=1477376905, app-argument=https://github.com/_view_fragments/issues/show/matplotlib/matplotlib/8823/issue_layout |
| twitter:image | https://opengraph.githubassets.com/9736d1ef1e46d2427ac667e2fbcf85a53236c95970ad8e959bf2cabbf83d3b75/matplotlib/matplotlib/issues/8823 |
| twitter:card | summary_large_image |
| og:image | https://opengraph.githubassets.com/9736d1ef1e46d2427ac667e2fbcf85a53236c95970ad8e959bf2cabbf83d3b75/matplotlib/matplotlib/issues/8823 |
| og:image:alt | Bug report Changing plot alignment for different placing of colorbar() in twinx plot If one combines a pcolormesh plot/hist2d plot with a standard plot by using twinx, the graph from the plot moves... |
| og:image:width | 1200 |
| og:image:height | 600 |
| og:site_name | GitHub |
| og:type | object |
| og:author:username | PrometheusPi |
| hostname | github.com |
| expected-hostname | github.com |
| None | b9a586c06a05a7a86fc7e3f4dbd03e42f6869085879aa184aa6369456dbd50fb |
| turbo-cache-control | no-preview |
| go-import | github.com/matplotlib/matplotlib git https://github.com/matplotlib/matplotlib.git |
| octolytics-dimension-user_id | 215947 |
| octolytics-dimension-user_login | matplotlib |
| octolytics-dimension-repository_id | 1385122 |
| octolytics-dimension-repository_nwo | matplotlib/matplotlib |
| octolytics-dimension-repository_public | true |
| octolytics-dimension-repository_is_fork | false |
| octolytics-dimension-repository_network_root_id | 1385122 |
| octolytics-dimension-repository_network_root_nwo | matplotlib/matplotlib |
| turbo-body-classes | logged-out env-production page-responsive |
| disable-turbo | false |
| browser-stats-url | https://api.github.com/_private/browser/stats |
| browser-errors-url | https://api.github.com/_private/browser/errors |
| release | 07a982c1d40157c619b364352b704c3ce66bb332 |
| ui-target | full |
| theme-color | #1e2327 |
| color-scheme | light dark |
Links:
Viewport: width=device-width

