Title: legend handle size does not automatically scale with linewidth · Issue #8789 · matplotlib/matplotlib · GitHub
Open Graph Title: legend handle size does not automatically scale with linewidth · Issue #8789 · matplotlib/matplotlib
X Title: legend handle size does not automatically scale with linewidth · Issue #8789 · matplotlib/matplotlib
Description: Bug report If I use a line style that's dash-dot plus a linewidth that's greater than 1, the linestyle doesn't appear in the legend if numpoints > 1. Here's linewidth == 1 and various line styles: And here's linewidth == 2 and various li...
Open Graph Description: Bug report If I use a line style that's dash-dot plus a linewidth that's greater than 1, the linestyle doesn't appear in the legend if numpoints > 1. Here's linewidth == 1 and various line styles: ...
X Description: Bug report If I use a line style that's dash-dot plus a linewidth that's greater than 1, the linestyle doesn't appear in the legend if numpoints > 1. Here's linewidth == 1 and va...
Opengraph URL: https://github.com/matplotlib/matplotlib/issues/8789
X: @github
Domain: github.com
{"@context":"https://schema.org","@type":"DiscussionForumPosting","headline":"legend handle size does not automatically scale with linewidth","articleBody":"### Bug report\r\n\r\nIf I use a line style that's dash-dot plus a linewidth that's greater than 1, the linestyle doesn't appear in the legend if numpoints \u003e 1.\r\n\r\nHere's linewidth == 1 and various line styles:\r\n\r\n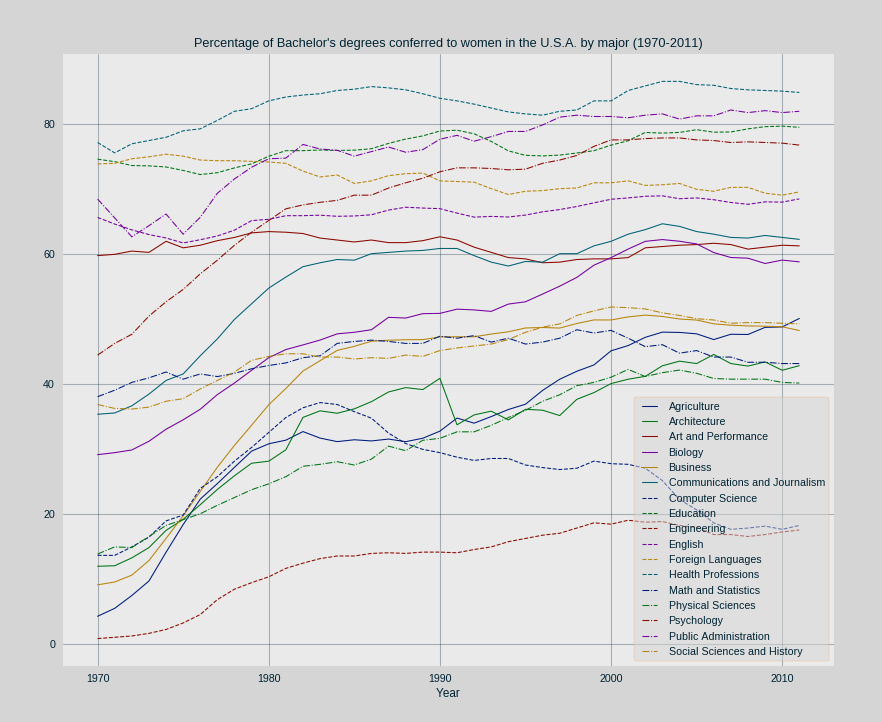\r\n\r\nAnd here's linewidth == 2 and various line styles:\r\n\r\n\r\n\r\nLegend is drawn with\r\n\r\n```python\r\nleftaxis.legend(handles=lines, loc='best', numpoints=3, frameon=True, fancybox=True, framealpha=0.5)\r\n```\r\nwhere `lines` are generated with `Axes.plot`.\r\n\r\n**Matplotlib version**\r\n\r\nLinux 16.04\r\nMatplotlib 2.0.2 with Agg backend, from source\r\nPython 2.7.13\r\n","author":{"url":"https://github.com/janssen","@type":"Person","name":"janssen"},"datePublished":"2017-06-22T16:42:07.000Z","interactionStatistic":{"@type":"InteractionCounter","interactionType":"https://schema.org/CommentAction","userInteractionCount":12},"url":"https://github.com/8789/matplotlib/issues/8789"}| route-pattern | /_view_fragments/issues/show/:user_id/:repository/:id/issue_layout(.:format) |
| route-controller | voltron_issues_fragments |
| route-action | issue_layout |
| fetch-nonce | v2:17e133bb-b2fb-b082-fca5-0055858f6dc6 |
| current-catalog-service-hash | 81bb79d38c15960b92d99bca9288a9108c7a47b18f2423d0f6438c5b7bcd2114 |
| request-id | 85CE:229C6A:12E2AF6:19264D4:6A5343FB |
| html-safe-nonce | 03482f32d0c4c1f907ae1ccc7dce8565aca67389404775217fec298975bfd8e5 |
| visitor-payload | eyJyZWZlcnJlciI6IiIsInJlcXVlc3RfaWQiOiI4NUNFOjIyOUM2QToxMkUyQUY2OjE5MjY0RDQ6NkE1MzQzRkIiLCJ2aXNpdG9yX2lkIjoiMzIxNTc3NzcwNzIwMDgyNDMxNSIsInJlZ2lvbl9lZGdlIjoiaWFkIiwicmVnaW9uX3JlbmRlciI6ImlhZCJ9 |
| visitor-hmac | eb108df383116d2a34d3b264c8e6f86e7c0a67f3512bf3a54478ff67c3683727 |
| hovercard-subject-tag | issue:237906324 |
| github-keyboard-shortcuts | repository,issues,copilot |
| google-site-verification | Apib7-x98H0j5cPqHWwSMm6dNU4GmODRoqxLiDzdx9I |
| octolytics-url | https://collector.github.com/github/collect |
| analytics-location | / |
| fb:app_id | 1401488693436528 |
| apple-itunes-app | app-id=1477376905, app-argument=https://github.com/_view_fragments/issues/show/matplotlib/matplotlib/8789/issue_layout |
| twitter:image | https://opengraph.githubassets.com/59612cb722d4bd39fccf5dd9425a7a68c3da24610563c16767161aa6a4b774ea/matplotlib/matplotlib/issues/8789 |
| twitter:card | summary_large_image |
| og:image | https://opengraph.githubassets.com/59612cb722d4bd39fccf5dd9425a7a68c3da24610563c16767161aa6a4b774ea/matplotlib/matplotlib/issues/8789 |
| og:image:alt | Bug report If I use a line style that's dash-dot plus a linewidth that's greater than 1, the linestyle doesn't appear in the legend if numpoints > 1. Here's linewidth == 1 and various line styles: ... |
| og:image:width | 1200 |
| og:image:height | 600 |
| og:site_name | GitHub |
| og:type | object |
| og:author:username | janssen |
| hostname | github.com |
| expected-hostname | github.com |
| None | b9a586c06a05a7a86fc7e3f4dbd03e42f6869085879aa184aa6369456dbd50fb |
| turbo-cache-control | no-preview |
| go-import | github.com/matplotlib/matplotlib git https://github.com/matplotlib/matplotlib.git |
| octolytics-dimension-user_id | 215947 |
| octolytics-dimension-user_login | matplotlib |
| octolytics-dimension-repository_id | 1385122 |
| octolytics-dimension-repository_nwo | matplotlib/matplotlib |
| octolytics-dimension-repository_public | true |
| octolytics-dimension-repository_is_fork | false |
| octolytics-dimension-repository_network_root_id | 1385122 |
| octolytics-dimension-repository_network_root_nwo | matplotlib/matplotlib |
| turbo-body-classes | logged-out env-production page-responsive |
| disable-turbo | false |
| browser-stats-url | https://api.github.com/_private/browser/stats |
| browser-errors-url | https://api.github.com/_private/browser/errors |
| release | 07a982c1d40157c619b364352b704c3ce66bb332 |
| ui-target | canary-2 |
| theme-color | #1e2327 |
| color-scheme | light dark |
Links:
Viewport: width=device-width

