Title: Minor offsetText formatting improvement · Issue #4451 · matplotlib/matplotlib · GitHub
Open Graph Title: Minor offsetText formatting improvement · Issue #4451 · matplotlib/matplotlib
X Title: Minor offsetText formatting improvement · Issue #4451 · matplotlib/matplotlib
Description: Currently, the axis offset text is always typeset with the format string "%1.10e" followed by some crazy postprocessing in ScalarFormatter._formatSciNotation. I would suggest switching to some "%g"-based format, so that e.g. 1234 doesn't...
Open Graph Description: Currently, the axis offset text is always typeset with the format string "%1.10e" followed by some crazy postprocessing in ScalarFormatter._formatSciNotation. I would suggest switching to some "%g"...
X Description: Currently, the axis offset text is always typeset with the format string "%1.10e" followed by some crazy postprocessing in ScalarFormatter._formatSciNotation. I would suggest switching to...
Opengraph URL: https://github.com/matplotlib/matplotlib/issues/4451
X: @github
Domain: github.com
{"@context":"https://schema.org","@type":"DiscussionForumPosting","headline":"Minor offsetText formatting improvement","articleBody":"Currently, the axis offset text is always typeset with the format string \"%1.10e\" followed by some crazy postprocessing in `ScalarFormatter._formatSciNotation`. I would suggest switching to some \"%g\"-based format, so that e.g. 1234 doesn't get formatted as \"1.234e3\" which can hardly be described as \"more legible\". Probably `_formatSciNotation` could be simplified a bit too.\r\n\r\nSimple example:\r\n\r\n```\r\npython -c 'from pylab import *; plot(*[1234 + arange(10)] * 2); show()'\r\n```\r\nEdit: the above is now fixed by the switch of axes.formatter.offset_threshold to 4, but the issue remains with\r\n```\r\npython -c 'from pylab import *; plot(*[12.321 + arange(5) * .001] * 2); show()'\r\n```\r\n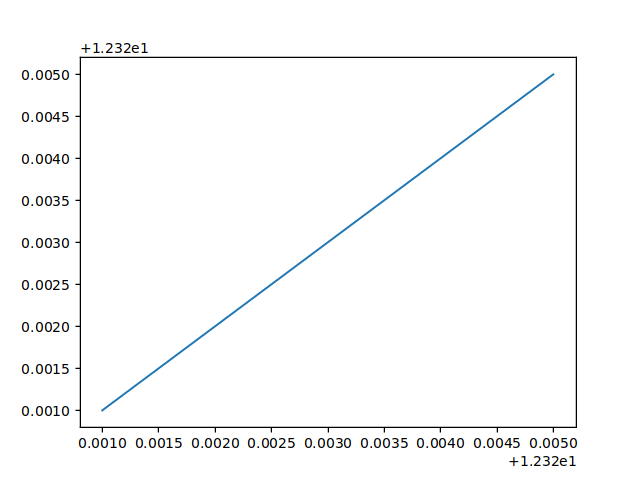\r\nwhere the offset text should be \"12.320\" (or at least \"12.32\"), not \"1.232e1\".\r\n","author":{"url":"https://github.com/anntzer","@type":"Person","name":"anntzer"},"datePublished":"2015-05-21T09:32:16.000Z","interactionStatistic":{"@type":"InteractionCounter","interactionType":"https://schema.org/CommentAction","userInteractionCount":3},"url":"https://github.com/4451/matplotlib/issues/4451"}| route-pattern | /_view_fragments/issues/show/:user_id/:repository/:id/issue_layout(.:format) |
| route-controller | voltron_issues_fragments |
| route-action | issue_layout |
| fetch-nonce | v2:ec90cb62-e15a-e655-b2b3-c5e693f74931 |
| current-catalog-service-hash | 81bb79d38c15960b92d99bca9288a9108c7a47b18f2423d0f6438c5b7bcd2114 |
| request-id | DB2C:1ECC24:105BF0B:15D9396:6A529B40 |
| html-safe-nonce | e47befeff90ca9be6c22dcd6ff6d08512187e25af47d2f4b234dab50acb53ae3 |
| visitor-payload | eyJyZWZlcnJlciI6IiIsInJlcXVlc3RfaWQiOiJEQjJDOjFFQ0MyNDoxMDVCRjBCOjE1RDkzOTY6NkE1MjlCNDAiLCJ2aXNpdG9yX2lkIjoiNDgyNzE0OTQyODM0NjQ5Mzc2MCIsInJlZ2lvbl9lZGdlIjoiaWFkIiwicmVnaW9uX3JlbmRlciI6ImlhZCJ9 |
| visitor-hmac | 4795362fa8f7f4501ed91c083b1f470071dc8240307426e140ad1a11a9f65eb2 |
| hovercard-subject-tag | issue:78912117 |
| github-keyboard-shortcuts | repository,issues,copilot |
| google-site-verification | Apib7-x98H0j5cPqHWwSMm6dNU4GmODRoqxLiDzdx9I |
| octolytics-url | https://collector.github.com/github/collect |
| analytics-location | / |
| fb:app_id | 1401488693436528 |
| apple-itunes-app | app-id=1477376905, app-argument=https://github.com/_view_fragments/issues/show/matplotlib/matplotlib/4451/issue_layout |
| twitter:image | https://opengraph.githubassets.com/5daa31a29748f6a424d1b04027a4343e10e092784d6810c33e531334265dbb77/matplotlib/matplotlib/issues/4451 |
| twitter:card | summary_large_image |
| og:image | https://opengraph.githubassets.com/5daa31a29748f6a424d1b04027a4343e10e092784d6810c33e531334265dbb77/matplotlib/matplotlib/issues/4451 |
| og:image:alt | Currently, the axis offset text is always typeset with the format string "%1.10e" followed by some crazy postprocessing in ScalarFormatter._formatSciNotation. I would suggest switching to some "%g"... |
| og:image:width | 1200 |
| og:image:height | 600 |
| og:site_name | GitHub |
| og:type | object |
| og:author:username | anntzer |
| hostname | github.com |
| expected-hostname | github.com |
| None | b9a586c06a05a7a86fc7e3f4dbd03e42f6869085879aa184aa6369456dbd50fb |
| turbo-cache-control | no-preview |
| go-import | github.com/matplotlib/matplotlib git https://github.com/matplotlib/matplotlib.git |
| octolytics-dimension-user_id | 215947 |
| octolytics-dimension-user_login | matplotlib |
| octolytics-dimension-repository_id | 1385122 |
| octolytics-dimension-repository_nwo | matplotlib/matplotlib |
| octolytics-dimension-repository_public | true |
| octolytics-dimension-repository_is_fork | false |
| octolytics-dimension-repository_network_root_id | 1385122 |
| octolytics-dimension-repository_network_root_nwo | matplotlib/matplotlib |
| turbo-body-classes | logged-out env-production page-responsive |
| disable-turbo | false |
| browser-stats-url | https://api.github.com/_private/browser/stats |
| browser-errors-url | https://api.github.com/_private/browser/errors |
| release | 07a982c1d40157c619b364352b704c3ce66bb332 |
| ui-target | full |
| theme-color | #1e2327 |
| color-scheme | light dark |
Links:
Viewport: width=device-width
