Title: Wishlist: Multidimensional colormaps · Issue #4369 · matplotlib/matplotlib · GitHub
Open Graph Title: Wishlist: Multidimensional colormaps · Issue #4369 · matplotlib/matplotlib
X Title: Wishlist: Multidimensional colormaps · Issue #4369 · matplotlib/matplotlib
Description: xref #3343 TL;DR: It would be nice if it were possible to have color maps for multidimensional data, instead of expecting the color to depend only on a single quantity as is currently the case. I'm currently working on an application tha...
Open Graph Description: xref #3343 TL;DR: It would be nice if it were possible to have color maps for multidimensional data, instead of expecting the color to depend only on a single quantity as is currently the case. I'm...
X Description: xref #3343 TL;DR: It would be nice if it were possible to have color maps for multidimensional data, instead of expecting the color to depend only on a single quantity as is currently the case. I&#...
Opengraph URL: https://github.com/matplotlib/matplotlib/issues/4369
X: @github
Domain: github.com
{"@context":"https://schema.org","@type":"DiscussionForumPosting","headline":"Wishlist: Multidimensional colormaps","articleBody":"xref #3343\n\nTL;DR: It would be nice if it were possible to have color maps for multidimensional data, instead of expecting the color to depend only on a single quantity as is currently the case.\n\nI'm currently working on an application that would like to be able to modulate the color and opacity of an image independently (as in Figure 3.B.b of [Allen et al. 2012](http://www.sciencedirect.com/science/article/pii/S089662731200428X)) so that color indicates a parameter estimate and opacity indicates a statistic assessing the reliability of that estimate:\n\n\n\nCurrently, this must be accomplished by applying a color map to the parameter estimate, then overwriting the alpha channel with the statistical map, and finally calling `imshow` with the computed RGBA data. (This is what @mwaskom is doing in the referenced issue.) This is a nuisance, and more importantly, it forces all interpolation to be done in RGBA space instead of in data space (xref #5490).\n\nRather than simply making it possible to control alpha independently of RGB, it would make sense to allow color maps that map multidimensional data to RGBA space. Then `imshow`'s color map for 3-dimensional input can default to _id \u0026oplus; 1_, and for 4-dimensional input to _id_, which gets rid of those special cases and makes it possible to have other color maps of those dimensionalities.\n\nOne could imagine other use cases for this in neuroimaging; for instance, [diffusion tensor images](http://en.wikipedia.org/wiki/Diffusion_MRI) are commonly displayed with hue depending on the principal eigenvector of a symmetric tensor field, while luminosity depends on the dispersion of the eigenvalues.\n\n\n\nIn a completely different direction, one could display [a complex-valued function](http://en.wikipedia.org/wiki/Theta_function) by splitting the complex data into real and imaginary parts, and then applying a two-dimensional color map that sets hue based on the argument and luminosity based on the modulus of the input:\n\n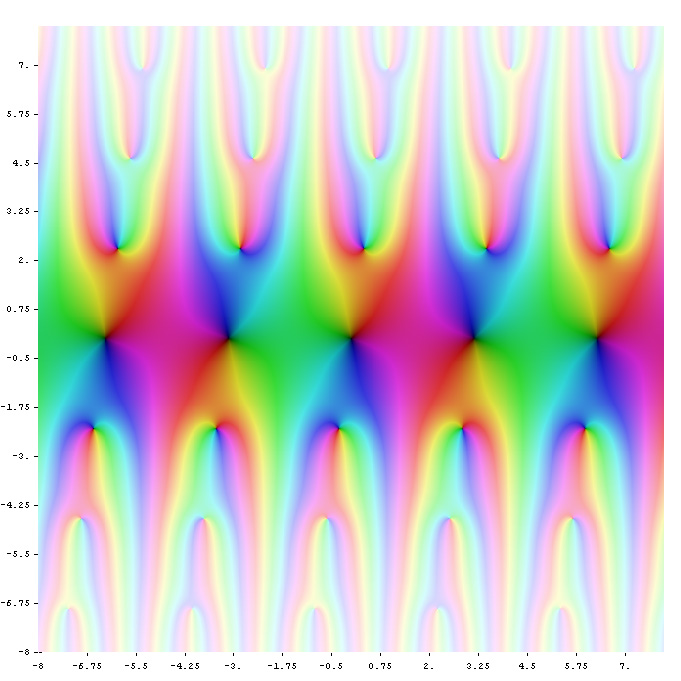\n","author":{"url":"https://github.com/ischwabacher","@type":"Person","name":"ischwabacher"},"datePublished":"2015-04-22T22:36:05.000Z","interactionStatistic":{"@type":"InteractionCounter","interactionType":"https://schema.org/CommentAction","userInteractionCount":13},"url":"https://github.com/4369/matplotlib/issues/4369"}| route-pattern | /_view_fragments/issues/show/:user_id/:repository/:id/issue_layout(.:format) |
| route-controller | voltron_issues_fragments |
| route-action | issue_layout |
| fetch-nonce | v2:24f3b215-b61e-d1a6-467f-90ae28f1fe1e |
| current-catalog-service-hash | 81bb79d38c15960b92d99bca9288a9108c7a47b18f2423d0f6438c5b7bcd2114 |
| request-id | E168:1F62C5:9B42DD:D345BA:6A52009C |
| html-safe-nonce | cc2b3d53c9fa5e1cf04c9513abf3908d200fcaf81d21e4c99635283edb74ed61 |
| visitor-payload | eyJyZWZlcnJlciI6IiIsInJlcXVlc3RfaWQiOiJFMTY4OjFGNjJDNTo5QjQyREQ6RDM0NUJBOjZBNTIwMDlDIiwidmlzaXRvcl9pZCI6IjU3NTg3MDgzNjE0NjcxMzQxMDgiLCJyZWdpb25fZWRnZSI6ImlhZCIsInJlZ2lvbl9yZW5kZXIiOiJpYWQifQ== |
| visitor-hmac | 1c9bb6d6cf4f251e1ff5dc6c3a9ff167e070ae4994c3e7698450bbcc430e92df |
| hovercard-subject-tag | issue:70252654 |
| github-keyboard-shortcuts | repository,issues,copilot |
| google-site-verification | Apib7-x98H0j5cPqHWwSMm6dNU4GmODRoqxLiDzdx9I |
| octolytics-url | https://collector.github.com/github/collect |
| analytics-location | / |
| fb:app_id | 1401488693436528 |
| apple-itunes-app | app-id=1477376905, app-argument=https://github.com/_view_fragments/issues/show/matplotlib/matplotlib/4369/issue_layout |
| twitter:image | https://opengraph.githubassets.com/b1f97662acdba94704d19ae0dac94b47d9a78e3ff55a4200ece69f8b385d72e7/matplotlib/matplotlib/issues/4369 |
| twitter:card | summary_large_image |
| og:image | https://opengraph.githubassets.com/b1f97662acdba94704d19ae0dac94b47d9a78e3ff55a4200ece69f8b385d72e7/matplotlib/matplotlib/issues/4369 |
| og:image:alt | xref #3343 TL;DR: It would be nice if it were possible to have color maps for multidimensional data, instead of expecting the color to depend only on a single quantity as is currently the case. I'm... |
| og:image:width | 1200 |
| og:image:height | 600 |
| og:site_name | GitHub |
| og:type | object |
| og:author:username | ischwabacher |
| hostname | github.com |
| expected-hostname | github.com |
| None | b9a586c06a05a7a86fc7e3f4dbd03e42f6869085879aa184aa6369456dbd50fb |
| turbo-cache-control | no-preview |
| go-import | github.com/matplotlib/matplotlib git https://github.com/matplotlib/matplotlib.git |
| octolytics-dimension-user_id | 215947 |
| octolytics-dimension-user_login | matplotlib |
| octolytics-dimension-repository_id | 1385122 |
| octolytics-dimension-repository_nwo | matplotlib/matplotlib |
| octolytics-dimension-repository_public | true |
| octolytics-dimension-repository_is_fork | false |
| octolytics-dimension-repository_network_root_id | 1385122 |
| octolytics-dimension-repository_network_root_nwo | matplotlib/matplotlib |
| turbo-body-classes | logged-out env-production page-responsive |
| disable-turbo | false |
| browser-stats-url | https://api.github.com/_private/browser/stats |
| browser-errors-url | https://api.github.com/_private/browser/errors |
| release | 7aed05249554b889eb33d002851a973eebcc7e91 |
| ui-target | full |
| theme-color | #1e2327 |
| color-scheme | light dark |
Links:
Viewport: width=device-width