Title: [ENH]: Built-in support for multi-color and multi-style text. · Issue #30890 · matplotlib/matplotlib · GitHub
Open Graph Title: [ENH]: Built-in support for multi-color and multi-style text. · Issue #30890 · matplotlib/matplotlib
X Title: [ENH]: Built-in support for multi-color and multi-style text. · Issue #30890 · matplotlib/matplotlib
Description: Problem Creating multi-colored or multi-styled text in Matplotlib requires manual positioning of each text segment with complex spacing calculations. Users currently need to calculate x-positions manually for each colored segment, which ...
Open Graph Description: Problem Creating multi-colored or multi-styled text in Matplotlib requires manual positioning of each text segment with complex spacing calculations. Users currently need to calculate x-positions m...
X Description: Problem Creating multi-colored or multi-styled text in Matplotlib requires manual positioning of each text segment with complex spacing calculations. Users currently need to calculate x-positions m...
Opengraph URL: https://github.com/matplotlib/matplotlib/issues/30890
X: @github
Domain: github.com
{"@context":"https://schema.org","@type":"DiscussionForumPosting","headline":"[ENH]: Built-in support for multi-color and multi-style text.","articleBody":"### Problem\n\nCreating multi-colored or multi-styled text in Matplotlib requires manual positioning of each text segment with complex spacing calculations.\nUsers currently need to calculate x-positions manually for each colored segment, which is tedious and error-prone, especially when text properties change.\n\n### Proposed solution\n\nAdd a `richtext()` function (or `ax.richtext()` method) that handles multi-color/multi-style text automatically:\n\n**Current approach (manual and tedious):**\n```python\nfig, ax = plt.subplots()\nax.text(0.1, 0.5, \"Hello\", color='red', fontsize=20)\nax.text(0.35, 0.5, \" \", fontsize=20) # Manual spacing calculation!\nax.text(0.4, 0.5, \"World\", color='blue', fontsize=20) # More manual work!\n```\n\n**Proposed approach (simple and automatic):**\n```python\nfig, ax = plt.subplots()\nax.richtext(0.5, 0.5,\n strings=[\"Hello\", \" \", \"World\"],\n colors=[\"red\", None, \"blue\"],\n fontsize=20, ha='center', va='center')\n```\n\n**Key Features:**\n- Accepts lists of text segments with corresponding colors/styles\n- Automatically calculates spacing and positioning\n- Supports word wrapping with `box_width` parameter\n- Flexible property specification (single values, lists, or dicts)\n- Compatible with all standard matplotlib text parameters\n\n**Example Use Cases:**\n1. **Data visualization**: Highlight specific values in different colors\n2. **Scientific plots**: Format chemical formulas, mathematical notation\n3. **Publication-quality figures**: Mixed text styling in titles/labels\n\n**Implementation:**\nI've created a working proof-of-concept package: [`mpl-richtext`](https://github.com/ra8in/mpl-richtext) (also on [PyPI](https://pypi.org/project/mpl-richtext/))\n\nThe implementation:\n- Uses matplotlib's renderer for accurate text measurements\n- Creates positioned Text objects automatically\n- ~400 lines of code\n- Handles alignment, wrapping, and various text properties\n\n**Example output:**\n\n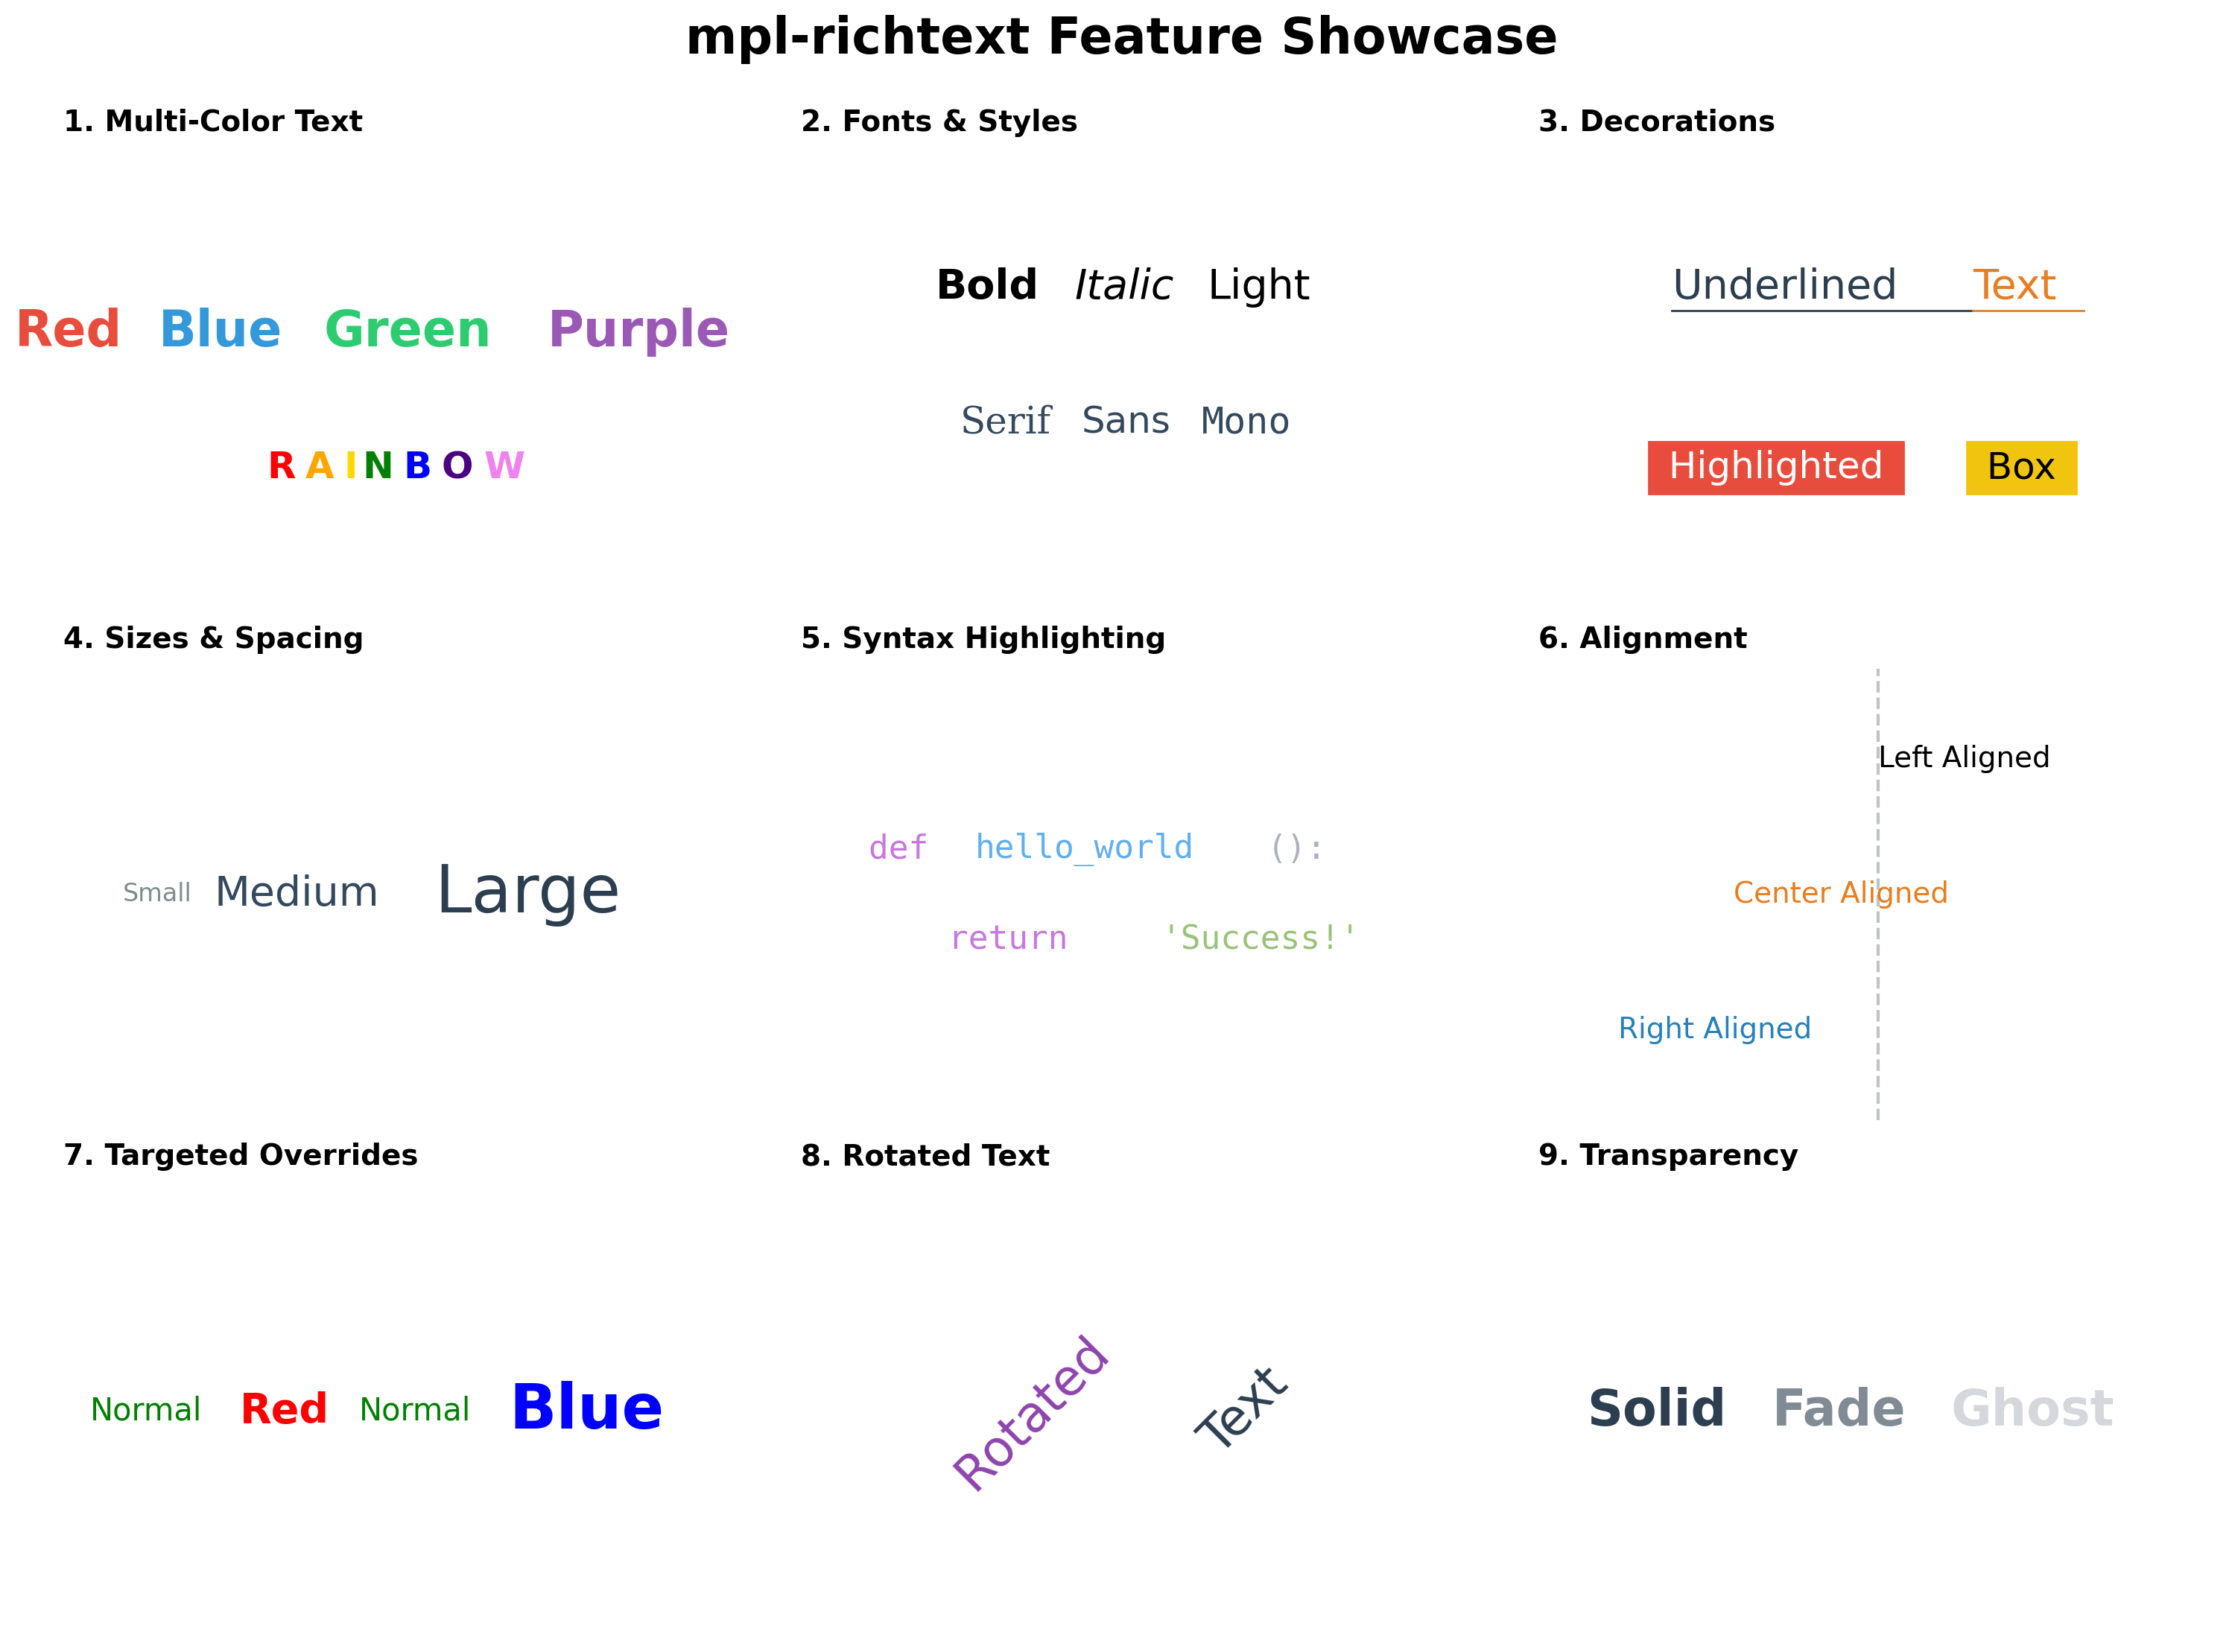\n\n**Questions for maintainers:**\n\n1. Is this functionality suitable for matplotlib core?\n2. Should it be a standalone function, an Axes method, or a custom Artist?\n3. Any concerns about the implementation approach?\n\nI'm willing to contribute this to matplotlib and adapt it based on maintainer feedback. Open to API redesign or implementation changes as needed.","author":{"url":"https://github.com/ra8in","@type":"Person","name":"ra8in"},"datePublished":"2025-12-22T04:10:33.000Z","interactionStatistic":{"@type":"InteractionCounter","interactionType":"https://schema.org/CommentAction","userInteractionCount":6},"url":"https://github.com/30890/matplotlib/issues/30890"}| route-pattern | /_view_fragments/issues/show/:user_id/:repository/:id/issue_layout(.:format) |
| route-controller | voltron_issues_fragments |
| route-action | issue_layout |
| fetch-nonce | v2:8adfc76c-5ce0-4809-5a9f-6835cc7dee41 |
| current-catalog-service-hash | 81bb79d38c15960b92d99bca9288a9108c7a47b18f2423d0f6438c5b7bcd2114 |
| request-id | 9128:2884D6:207812:2C2020:6A523EA5 |
| html-safe-nonce | 1d388bb3205c317ff3789f83b1b24d7ad37d0430aeee09a6dc4b0d16a7f32894 |
| visitor-payload | eyJyZWZlcnJlciI6IiIsInJlcXVlc3RfaWQiOiI5MTI4OjI4ODRENjoyMDc4MTI6MkMyMDIwOjZBNTIzRUE1IiwidmlzaXRvcl9pZCI6Ijg4MzEwMzcxMzU2MTAwNjg2NDUiLCJyZWdpb25fZWRnZSI6ImlhZCIsInJlZ2lvbl9yZW5kZXIiOiJpYWQifQ== |
| visitor-hmac | 326ecf560e1044abb27eb9a4f2509f3989c2d4fbc39ba68c1ab13d0b9a36da4b |
| hovercard-subject-tag | issue:3752241709 |
| github-keyboard-shortcuts | repository,issues,copilot |
| google-site-verification | Apib7-x98H0j5cPqHWwSMm6dNU4GmODRoqxLiDzdx9I |
| octolytics-url | https://collector.github.com/github/collect |
| analytics-location | / |
| fb:app_id | 1401488693436528 |
| apple-itunes-app | app-id=1477376905, app-argument=https://github.com/_view_fragments/issues/show/matplotlib/matplotlib/30890/issue_layout |
| twitter:image | https://opengraph.githubassets.com/8ca7170d57fabda835872e3d0c04ee9fe433c714b1a2f3687da48b1c6cdab7f7/matplotlib/matplotlib/issues/30890 |
| twitter:card | summary_large_image |
| og:image | https://opengraph.githubassets.com/8ca7170d57fabda835872e3d0c04ee9fe433c714b1a2f3687da48b1c6cdab7f7/matplotlib/matplotlib/issues/30890 |
| og:image:alt | Problem Creating multi-colored or multi-styled text in Matplotlib requires manual positioning of each text segment with complex spacing calculations. Users currently need to calculate x-positions m... |
| og:image:width | 1200 |
| og:image:height | 600 |
| og:site_name | GitHub |
| og:type | object |
| og:author:username | ra8in |
| hostname | github.com |
| expected-hostname | github.com |
| None | b9a586c06a05a7a86fc7e3f4dbd03e42f6869085879aa184aa6369456dbd50fb |
| turbo-cache-control | no-preview |
| go-import | github.com/matplotlib/matplotlib git https://github.com/matplotlib/matplotlib.git |
| octolytics-dimension-user_id | 215947 |
| octolytics-dimension-user_login | matplotlib |
| octolytics-dimension-repository_id | 1385122 |
| octolytics-dimension-repository_nwo | matplotlib/matplotlib |
| octolytics-dimension-repository_public | true |
| octolytics-dimension-repository_is_fork | false |
| octolytics-dimension-repository_network_root_id | 1385122 |
| octolytics-dimension-repository_network_root_nwo | matplotlib/matplotlib |
| turbo-body-classes | logged-out env-production page-responsive |
| disable-turbo | false |
| browser-stats-url | https://api.github.com/_private/browser/stats |
| browser-errors-url | https://api.github.com/_private/browser/errors |
| release | 7aed05249554b889eb33d002851a973eebcc7e91 |
| ui-target | full |
| theme-color | #1e2327 |
| color-scheme | light dark |
Links:
Viewport: width=device-width
