Title: [Bug]: ValueError: The 'color' keyword argument must have one color per dataset · Issue #30857 · matplotlib/matplotlib · GitHub
Open Graph Title: [Bug]: ValueError: The 'color' keyword argument must have one color per dataset · Issue #30857 · matplotlib/matplotlib
X Title: [Bug]: ValueError: The 'color' keyword argument must have one color per dataset · Issue #30857 · matplotlib/matplotlib
Description: Bug summary We can plot multiple lines in one color with plt.plot, but not with plt.hist. I'm not sure if this considered as a bug, but I can't understand why hist force this requirement. Code for reproduction import matplotlib.pyplot as...
Open Graph Description: Bug summary We can plot multiple lines in one color with plt.plot, but not with plt.hist. I'm not sure if this considered as a bug, but I can't understand why hist force this requirement. Code for ...
X Description: Bug summary We can plot multiple lines in one color with plt.plot, but not with plt.hist. I'm not sure if this considered as a bug, but I can't understand why hist force this requirement. C...
Opengraph URL: https://github.com/matplotlib/matplotlib/issues/30857
X: @github
Domain: github.com
{"@context":"https://schema.org","@type":"DiscussionForumPosting","headline":"[Bug]: ValueError: The 'color' keyword argument must have one color per dataset","articleBody":"### Bug summary\n\nWe can plot multiple lines in one color with `plt.plot`, but not with `plt.hist`.\nI'm not sure if this considered as a bug, but I can't understand why hist force this requirement.\n\n\n### Code for reproduction\n\n```Python\nimport matplotlib.pyplot as plt\n\ndata = [[0, 1, 2], [3, 4, 5]]\n\nplt.plot(data, color='k')\nplt.show()\n\nplt.hist(data, color='k')\n```\n\n### Actual outcome\n\n`plt.plot` works as expected, but `plt.hist` get the following error\n\u003e ValueError: The 'color' keyword argument must have one color per dataset, but 2 datasets and 1 colors were provided.\n\n### Expected outcome\n\nJust plot the histograms in same color\nWhat I want to achieve is \n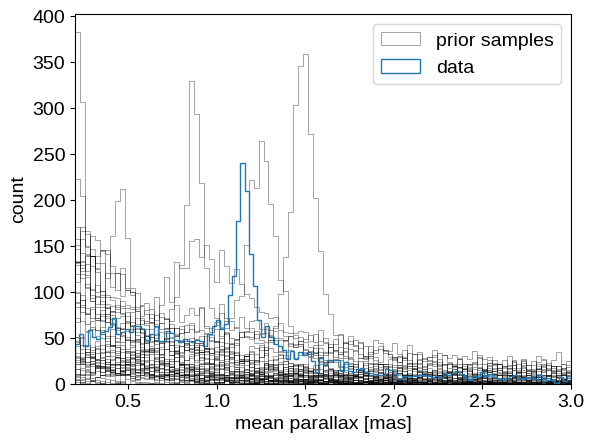\n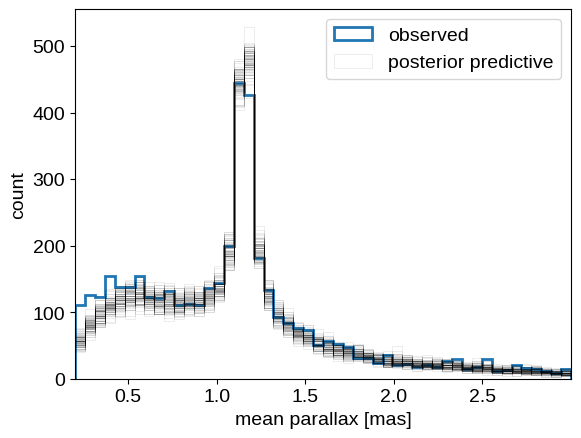\n\n### Additional information\n\n_No response_\n\n### Operating system\n\n_No response_\n\n### Matplotlib Version\n\n3.10.8\n\n### Matplotlib Backend\n\n_No response_\n\n### Python version\n\n_No response_\n\n### Jupyter version\n\n_No response_\n\n### Installation\n\nNone","author":{"url":"https://github.com/gapplef","@type":"Person","name":"gapplef"},"datePublished":"2025-12-14T13:47:52.000Z","interactionStatistic":{"@type":"InteractionCounter","interactionType":"https://schema.org/CommentAction","userInteractionCount":12},"url":"https://github.com/30857/matplotlib/issues/30857"}| route-pattern | /_view_fragments/issues/show/:user_id/:repository/:id/issue_layout(.:format) |
| route-controller | voltron_issues_fragments |
| route-action | issue_layout |
| fetch-nonce | v2:fb33d760-914e-4686-903c-048c09c47d4a |
| current-catalog-service-hash | 81bb79d38c15960b92d99bca9288a9108c7a47b18f2423d0f6438c5b7bcd2114 |
| request-id | DAC4:2D2272:F498A5:146EB67:6A51BD49 |
| html-safe-nonce | 2c8751909bdd047e0b194daa561cf7caf82cafd643923ece08ff5d400952e230 |
| visitor-payload | eyJyZWZlcnJlciI6IiIsInJlcXVlc3RfaWQiOiJEQUM0OjJEMjI3MjpGNDk4QTU6MTQ2RUI2Nzo2QTUxQkQ0OSIsInZpc2l0b3JfaWQiOiI0NjU5OTUyNTkyMTAwNjM4MDI1IiwicmVnaW9uX2VkZ2UiOiJpYWQiLCJyZWdpb25fcmVuZGVyIjoiaWFkIn0= |
| visitor-hmac | b0f0c28c8ddb230c8ca2c8be8701e03891fbfdb31d6e908df888b45f43b677b8 |
| hovercard-subject-tag | issue:3727396071 |
| github-keyboard-shortcuts | repository,issues,copilot |
| google-site-verification | Apib7-x98H0j5cPqHWwSMm6dNU4GmODRoqxLiDzdx9I |
| octolytics-url | https://collector.github.com/github/collect |
| analytics-location | / |
| fb:app_id | 1401488693436528 |
| apple-itunes-app | app-id=1477376905, app-argument=https://github.com/_view_fragments/issues/show/matplotlib/matplotlib/30857/issue_layout |
| twitter:image | https://opengraph.githubassets.com/d71b976eda3736caa330e103bc9e9427ef9f33e52270ca9f59b58f6b40a52f08/matplotlib/matplotlib/issues/30857 |
| twitter:card | summary_large_image |
| og:image | https://opengraph.githubassets.com/d71b976eda3736caa330e103bc9e9427ef9f33e52270ca9f59b58f6b40a52f08/matplotlib/matplotlib/issues/30857 |
| og:image:alt | Bug summary We can plot multiple lines in one color with plt.plot, but not with plt.hist. I'm not sure if this considered as a bug, but I can't understand why hist force this requirement. Code for ... |
| og:image:width | 1200 |
| og:image:height | 600 |
| og:site_name | GitHub |
| og:type | object |
| og:author:username | gapplef |
| hostname | github.com |
| expected-hostname | github.com |
| None | b9a586c06a05a7a86fc7e3f4dbd03e42f6869085879aa184aa6369456dbd50fb |
| turbo-cache-control | no-preview |
| go-import | github.com/matplotlib/matplotlib git https://github.com/matplotlib/matplotlib.git |
| octolytics-dimension-user_id | 215947 |
| octolytics-dimension-user_login | matplotlib |
| octolytics-dimension-repository_id | 1385122 |
| octolytics-dimension-repository_nwo | matplotlib/matplotlib |
| octolytics-dimension-repository_public | true |
| octolytics-dimension-repository_is_fork | false |
| octolytics-dimension-repository_network_root_id | 1385122 |
| octolytics-dimension-repository_network_root_nwo | matplotlib/matplotlib |
| turbo-body-classes | logged-out env-production page-responsive |
| disable-turbo | false |
| browser-stats-url | https://api.github.com/_private/browser/stats |
| browser-errors-url | https://api.github.com/_private/browser/errors |
| release | 7aed05249554b889eb33d002851a973eebcc7e91 |
| ui-target | full |
| theme-color | #1e2327 |
| color-scheme | light dark |
Links:
Viewport: width=device-width