Title: [Bug]: Nan values in scatter 3d plot show in black colour when alpha parameter is passed. · Issue #25446 · matplotlib/matplotlib · GitHub
Open Graph Title: [Bug]: Nan values in scatter 3d plot show in black colour when alpha parameter is passed. · Issue #25446 · matplotlib/matplotlib
X Title: [Bug]: Nan values in scatter 3d plot show in black colour when alpha parameter is passed. · Issue #25446 · matplotlib/matplotlib
Description: Bug summary In a projection='3d' axis, a scatter plot with the c argument to colour the points is showing black markers in the position of nan values if the alpha argument is passed. If the alpha argument is not present, the nan values a...
Open Graph Description: Bug summary In a projection='3d' axis, a scatter plot with the c argument to colour the points is showing black markers in the position of nan values if the alpha argument is passed. If the alpha a...
X Description: Bug summary In a projection='3d' axis, a scatter plot with the c argument to colour the points is showing black markers in the position of nan values if the alpha argument is passed. If the...
Opengraph URL: https://github.com/matplotlib/matplotlib/issues/25446
X: @github
Domain: github.com
{"@context":"https://schema.org","@type":"DiscussionForumPosting","headline":"[Bug]: Nan values in scatter 3d plot show in black colour when alpha parameter is passed.","articleBody":"### Bug summary\n\nIn a `projection='3d'` axis, a scatter plot with the `c` argument to colour the points is showing black markers in the position of nan values if the `alpha` argument is passed. If the `alpha` argument is not present, the nan values are not displayed, as expected. If the `alpha` argument is present, even with `alpha = 1`, the markers are coloured black.\n\n### Code for reproduction\n\n```python\nn_x = 200\r\nn_y = 1\r\nn_z = 200\r\n\r\n_x = np.linspace(-10,10,n_x)\r\n_y = 0 \r\n_z = np.linspace(-10,10,n_z)\r\n\r\n_xx, _yy, _zz = np.meshgrid(_x, _y, _z, indexing='ij')\r\nc = np.array(np.arange(n_x*n_y*n_z, dtype = float).reshape(n_x,n_y,n_z))\r\nc[int(n_x/4):int(n_x/2),:,:] = np.nan\r\n\r\nfig = plt.figure(figsize=(12, 5))\r\nax0 = fig.add_subplot(121, projection='3d')\r\nax0.scatter(_xx, _yy, _zz, c = c, marker = 's')\r\nax0.set_title('`alpha` OFF')\r\nax1 = fig.add_subplot(122, projection='3d')\r\nax1.set_title('`alpha` ON')\r\nscat3d = ax1.scatter(_xx, _yy, _zz, c = c, \r\n marker = 's', alpha = 1)\r\n\r\nplt.show()\n```\n\n\n### Actual outcome\n\n\r\n\n\n### Expected outcome\n\n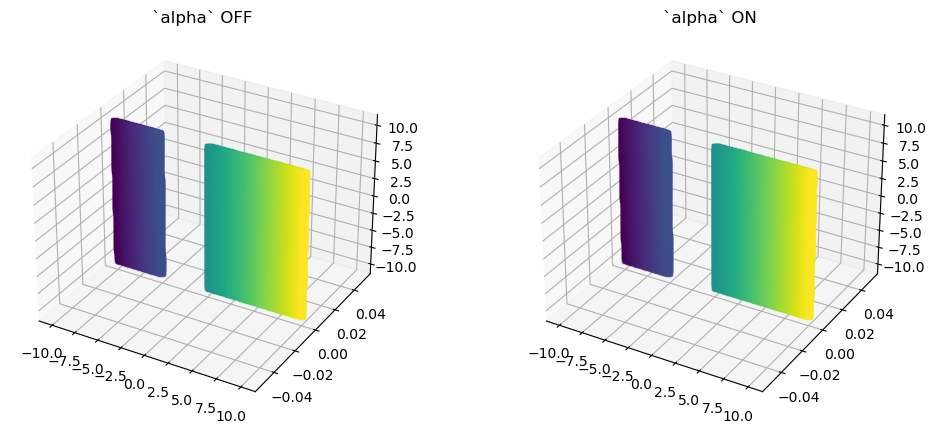\r\n\n\n### Additional information\n\n_No response_\n\n### Operating system\n\nUbuntu\n\n### Matplotlib Version\n\n3.7.0\n\n### Matplotlib Backend\n\nmodule://matplotlib_inline.backend_inline\n\n### Python version\n\nPython 3.10.9\n\n### Jupyter version\n\n6.5.2\n\n### Installation\n\nconda","author":{"url":"https://github.com/ricmperes","@type":"Person","name":"ricmperes"},"datePublished":"2023-03-13T18:38:06.000Z","interactionStatistic":{"@type":"InteractionCounter","interactionType":"https://schema.org/CommentAction","userInteractionCount":5},"url":"https://github.com/25446/matplotlib/issues/25446"}| route-pattern | /_view_fragments/issues/show/:user_id/:repository/:id/issue_layout(.:format) |
| route-controller | voltron_issues_fragments |
| route-action | issue_layout |
| fetch-nonce | v2:0066b85e-ebc9-79e8-a31f-06a9412fca22 |
| current-catalog-service-hash | 81bb79d38c15960b92d99bca9288a9108c7a47b18f2423d0f6438c5b7bcd2114 |
| request-id | 9534:99A22:C0E18C:1037C48:6A51633C |
| html-safe-nonce | 8caf1ebfe8ed46f31eaca5d250c30d0ef51765989be6f3760ae783ce93f44255 |
| visitor-payload | eyJyZWZlcnJlciI6IiIsInJlcXVlc3RfaWQiOiI5NTM0Ojk5QTIyOkMwRTE4QzoxMDM3QzQ4OjZBNTE2MzNDIiwidmlzaXRvcl9pZCI6IjYxOTU5NTIyODg2NTExMDkxODAiLCJyZWdpb25fZWRnZSI6ImlhZCIsInJlZ2lvbl9yZW5kZXIiOiJpYWQifQ== |
| visitor-hmac | 01bf8a9dd5f862b0026d0b5af0106b88bf55c733b402a9dab5e1fc350e0de5db |
| hovercard-subject-tag | issue:1622047955 |
| github-keyboard-shortcuts | repository,issues,copilot |
| google-site-verification | Apib7-x98H0j5cPqHWwSMm6dNU4GmODRoqxLiDzdx9I |
| octolytics-url | https://collector.github.com/github/collect |
| analytics-location | / |
| fb:app_id | 1401488693436528 |
| apple-itunes-app | app-id=1477376905, app-argument=https://github.com/_view_fragments/issues/show/matplotlib/matplotlib/25446/issue_layout |
| twitter:image | https://opengraph.githubassets.com/86f13efcf152668371c9d4e02385bc6a27374463d312dd96e93b927c984478a4/matplotlib/matplotlib/issues/25446 |
| twitter:card | summary_large_image |
| og:image | https://opengraph.githubassets.com/86f13efcf152668371c9d4e02385bc6a27374463d312dd96e93b927c984478a4/matplotlib/matplotlib/issues/25446 |
| og:image:alt | Bug summary In a projection='3d' axis, a scatter plot with the c argument to colour the points is showing black markers in the position of nan values if the alpha argument is passed. If the alpha a... |
| og:image:width | 1200 |
| og:image:height | 600 |
| og:site_name | GitHub |
| og:type | object |
| og:author:username | ricmperes |
| hostname | github.com |
| expected-hostname | github.com |
| None | b9a586c06a05a7a86fc7e3f4dbd03e42f6869085879aa184aa6369456dbd50fb |
| turbo-cache-control | no-preview |
| go-import | github.com/matplotlib/matplotlib git https://github.com/matplotlib/matplotlib.git |
| octolytics-dimension-user_id | 215947 |
| octolytics-dimension-user_login | matplotlib |
| octolytics-dimension-repository_id | 1385122 |
| octolytics-dimension-repository_nwo | matplotlib/matplotlib |
| octolytics-dimension-repository_public | true |
| octolytics-dimension-repository_is_fork | false |
| octolytics-dimension-repository_network_root_id | 1385122 |
| octolytics-dimension-repository_network_root_nwo | matplotlib/matplotlib |
| turbo-body-classes | logged-out env-production page-responsive |
| disable-turbo | false |
| browser-stats-url | https://api.github.com/_private/browser/stats |
| browser-errors-url | https://api.github.com/_private/browser/errors |
| release | 2eeb434949a926fad21064b4d395a54759f7a0b2 |
| ui-target | full |
| theme-color | #1e2327 |
| color-scheme | light dark |
Links:
Viewport: width=device-width

