Title: [Bug]: matplotlib.path.Path.to_polygons fails with TriContourSet paths · Issue #25114 · matplotlib/matplotlib · GitHub
Open Graph Title: [Bug]: matplotlib.path.Path.to_polygons fails with TriContourSet paths · Issue #25114 · matplotlib/matplotlib
X Title: [Bug]: matplotlib.path.Path.to_polygons fails with TriContourSet paths · Issue #25114 · matplotlib/matplotlib
Description: Bug summary The Path objects produced by tricontourf to draw its contours lead to spurious polygons when running the respective to_polygons method. Code for reproduction import numpy as np import matplotlib as mpl import matplotlib.pyplo...
Open Graph Description: Bug summary The Path objects produced by tricontourf to draw its contours lead to spurious polygons when running the respective to_polygons method. Code for reproduction import numpy as np import m...
X Description: Bug summary The Path objects produced by tricontourf to draw its contours lead to spurious polygons when running the respective to_polygons method. Code for reproduction import numpy as np import m...
Opengraph URL: https://github.com/matplotlib/matplotlib/issues/25114
X: @github
Domain: github.com
{"@context":"https://schema.org","@type":"DiscussionForumPosting","headline":"[Bug]: matplotlib.path.Path.to_polygons fails with TriContourSet paths","articleBody":"### Bug summary\n\nThe [Path](https://matplotlib.org/stable/api/path_api.html#matplotlib.path.Path) objects produced by [tricontourf](https://matplotlib.org/stable/api/_as_gen/matplotlib.pyplot.tricontourf.html) to draw its contours lead to spurious polygons when running the respective `to_polygons` method.\r\n\n\n### Code for reproduction\n\n```python\nimport numpy as np\r\nimport matplotlib as mpl\r\nimport matplotlib.pyplot as plt\r\nimport matplotlib.tri\r\n\r\n# Example for TriContour based from:\r\n# https://matplotlib.org/2.0.2/examples/pylab_examples/tricontour_smooth_delaunay.html\r\n\r\n\r\ndef experiment_res(x, y):\r\n \"\"\" An analytic function representing experiment results \"\"\"\r\n x = 2.*x\r\n r1 = np.sqrt((0.5 - x)**2 + (0.5 - y)**2)\r\n theta1 = np.arctan2(0.5 - x, 0.5 - y)\r\n r2 = np.sqrt((-x - 0.2)**2 + (-y - 0.2)**2)\r\n theta2 = np.arctan2(-x - 0.2, -y - 0.2)\r\n z = (4*(np.exp((r1/10)**2) - 1)*30. * np.cos(3*theta1) +\r\n (np.exp((r2/10)**2) - 1)*30. * np.cos(5*theta2) +\r\n 2*(x**2 + y**2))\r\n return (np.max(z) - z)/(np.max(z) - np.min(z))\r\n\r\nn = 200\r\nrandom_gen = np.random.mtrand.RandomState(seed=127260)\r\nx = random_gen.uniform(-1., 1., size=n)\r\ny = random_gen.uniform(-1., 1., size=n)\r\nv = experiment_res(x, y)\r\n\r\n## triangulate\r\ntri = mpl.tri.Triangulation(x, y)\r\nmask = mpl.tri.TriAnalyzer(tri).get_flat_tri_mask(min_circle_ratio=.01)\r\ntri.set_mask(mask)\r\n\r\n## refine triangular mesh\r\nrefiner = mpl.tri.UniformTriRefiner(tri)\r\ntriFiner, vFiner = refiner.refine_field(v, subdiv=2) # uses CubicTriInterpolator\r\n\r\n## plot the mesh\r\nplt.close('all')\r\nplt.triplot(tri, color='k', lw=.8)\r\nplt.triplot(triFiner, color='k', alpha=.3, lw=.5)\r\nplt.show()\r\n\r\n## plot and create TriCounterSet object\r\nlevels = [.7, .9, 1]\r\ncmap = mpl.cm.plasma\r\nplt.close('all')\r\ncl = plt.tricontour(triFiner, vFiner, levels=levels, colors='k', linewidths=2, linestyles='--')\r\ncf = plt.tricontourf(triFiner, vFiner, levels=levels, cmap=cmap, extend='both', alpha=.8)\r\n_ = [collection.set_edgecolor(\"face\") for collection in cf.collections] # https://stackoverflow.com/a/73805556/921580\r\nplt.triplot(tri, color='k', lw=1.5, alpha=.1) # refined mesh\r\nplt.triplot(triFiner, color='k', lw=.5, alpha=.1) # original mesh\r\ncb = plt.colorbar(cf)\r\nplt.show()\r\n\r\n## retrieve contours from TriContourSet (paths) and convert to polygons\r\nfor i in range(len(cf.collections)):\r\n plt.gca().set_xlim(-1.1, 1.1)\r\n plt.gca().set_ylim(-1.1, 1.1)\r\n [plt.gca().add_patch(\r\n mpl.patches.PathPatch(\r\n cf.collections[i].get_paths()[j],\r\n facecolor=cf.collections[i].get_facecolor()\r\n )\r\n ) for j in range(len(cf.collections[i].get_paths()))]\r\n [plt.plot(*list(zip(*p)), c='red', ls='--') \r\n for path in cf.collections[i].get_paths()\r\n for p in path.to_polygons()\r\n ]\r\n if i == (len(cf.collections) - 2):\r\n plt.savefig('bug_actual_outcome.png')\r\n plt.show()\r\n\r\n## compare path vertices with output from to_polygons method\r\npath = cf.collections[-2].get_paths()[0]\r\nprint(\"\\npath vertices and codes:\\n\", path)\r\nprint(\"\\npath.to_polygons() = \\n\", path.to_polygons())\n```\n\n\n### Actual outcome\n\n\n\n### Expected outcome\n\n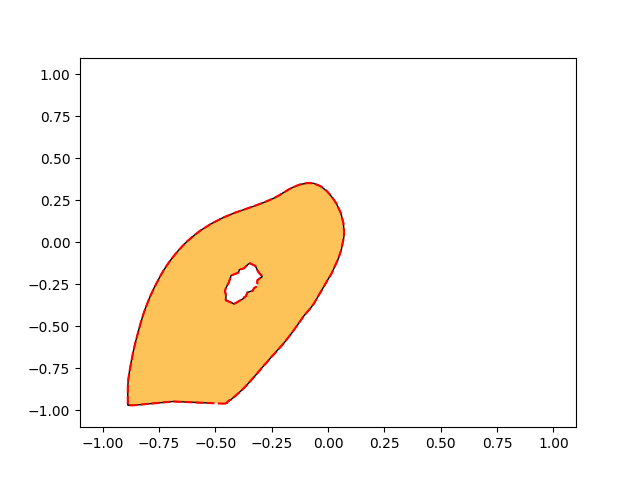\r\n\n\n### Additional information\n\nThe issue seems to be related to the [Path](https://matplotlib.org/stable/api/path_api.html#matplotlib.path.Path) object and its `to_polygons` method. More specifically the problem may happen when a Path contains multiple polylines but is defined without the `CLOSEPOLY` codes ending each polyline. When producing contour plots the code can cope with this data without problems, but the `to_polygons` method cannot.\r\n\r\nI have tested in both 3.4.1 and 3.0.2 versions and both have the same problem.\r\n\r\nI have a fix where I defined a function `path2polygons`:\r\n\r\n```python\r\ndef path2polygons(path):\r\n assert isinstance(path, mpl.path.Path), f\"Type of input is {type(path)} instead of Path.\"\r\n codesOld = path.codes[path.codes != mpl.path.Path.CLOSEPOLY]\r\n vertsOld = path.vertices[path.codes != mpl.path.Path.CLOSEPOLY]\r\n jj = np.append(np.flatnonzero(codesOld == path.MOVETO), [len(codesOld)])\r\n verts, codes = [], []\r\n for ji, je in zip(jj[:-1], jj[1:]):\r\n codes.extend( [mpl.path.Path.MOVETO]\r\n + [mpl.path.Path.LINETO]*(je - ji - 1)\r\n + [mpl.path.Path.CLOSEPOLY]\r\n )\r\n verts.extend( list(vertsOld[ji:je]) + [vertsOld[ji]] )\r\n return mpl.path.Path(verts, codes).to_polygons()\r\n```\r\nbut is not tested with other Path codes such as `CURVE3` and `CURVE4`.\r\n\n\n### Operating system\n\nDebian 10\n\n### Matplotlib Version\n\n3.4.1\n\n### Matplotlib Backend\n\nTkAgg\n\n### Python version\n\n3.7.3\n\n### Jupyter version\n\n_No response_\n\n### Installation\n\npip","author":{"url":"https://github.com/cvr","@type":"Person","name":"cvr"},"datePublished":"2023-01-31T17:00:35.000Z","interactionStatistic":{"@type":"InteractionCounter","interactionType":"https://schema.org/CommentAction","userInteractionCount":3},"url":"https://github.com/25114/matplotlib/issues/25114"}| route-pattern | /_view_fragments/issues/show/:user_id/:repository/:id/issue_layout(.:format) |
| route-controller | voltron_issues_fragments |
| route-action | issue_layout |
| fetch-nonce | v2:36e9ebd8-1c06-c9f8-0fbf-77d213d358bc |
| current-catalog-service-hash | 81bb79d38c15960b92d99bca9288a9108c7a47b18f2423d0f6438c5b7bcd2114 |
| request-id | E5D6:399A66:CCC47B:1178F3D:6A53A60F |
| html-safe-nonce | 802442d25146bee7d4830bf211b26b33d2e53013f71d4be1b8880563b61e3a7e |
| visitor-payload | eyJyZWZlcnJlciI6IiIsInJlcXVlc3RfaWQiOiJFNUQ2OjM5OUE2NjpDQ0M0N0I6MTE3OEYzRDo2QTUzQTYwRiIsInZpc2l0b3JfaWQiOiIzMzE4NTIxODcxOTA2MDg4NDYzIiwicmVnaW9uX2VkZ2UiOiJpYWQiLCJyZWdpb25fcmVuZGVyIjoiaWFkIn0= |
| visitor-hmac | 9389464dd77a0c58b6eff2faa6cf4ec7a2739d9e4f483a70f12f22ff7e668402 |
| hovercard-subject-tag | issue:1564688938 |
| github-keyboard-shortcuts | repository,issues,copilot |
| google-site-verification | Apib7-x98H0j5cPqHWwSMm6dNU4GmODRoqxLiDzdx9I |
| octolytics-url | https://collector.github.com/github/collect |
| analytics-location | / |
| fb:app_id | 1401488693436528 |
| apple-itunes-app | app-id=1477376905, app-argument=https://github.com/_view_fragments/issues/show/matplotlib/matplotlib/25114/issue_layout |
| twitter:image | https://opengraph.githubassets.com/8048cc2715f1a3bfc56c8d699e209d4ccf828c4f92f35cc0fd7a36a74542af18/matplotlib/matplotlib/issues/25114 |
| twitter:card | summary_large_image |
| og:image | https://opengraph.githubassets.com/8048cc2715f1a3bfc56c8d699e209d4ccf828c4f92f35cc0fd7a36a74542af18/matplotlib/matplotlib/issues/25114 |
| og:image:alt | Bug summary The Path objects produced by tricontourf to draw its contours lead to spurious polygons when running the respective to_polygons method. Code for reproduction import numpy as np import m... |
| og:image:width | 1200 |
| og:image:height | 600 |
| og:site_name | GitHub |
| og:type | object |
| og:author:username | cvr |
| hostname | github.com |
| expected-hostname | github.com |
| None | b9a586c06a05a7a86fc7e3f4dbd03e42f6869085879aa184aa6369456dbd50fb |
| turbo-cache-control | no-preview |
| go-import | github.com/matplotlib/matplotlib git https://github.com/matplotlib/matplotlib.git |
| octolytics-dimension-user_id | 215947 |
| octolytics-dimension-user_login | matplotlib |
| octolytics-dimension-repository_id | 1385122 |
| octolytics-dimension-repository_nwo | matplotlib/matplotlib |
| octolytics-dimension-repository_public | true |
| octolytics-dimension-repository_is_fork | false |
| octolytics-dimension-repository_network_root_id | 1385122 |
| octolytics-dimension-repository_network_root_nwo | matplotlib/matplotlib |
| turbo-body-classes | logged-out env-production page-responsive |
| disable-turbo | false |
| browser-stats-url | https://api.github.com/_private/browser/stats |
| browser-errors-url | https://api.github.com/_private/browser/errors |
| release | 07a982c1d40157c619b364352b704c3ce66bb332 |
| ui-target | canary-2 |
| theme-color | #1e2327 |
| color-scheme | light dark |
Links:
Viewport: width=device-width

