Title: Issue · GitHub
Open Graph Title: Issue · matplotlib/matplotlib
X Title: Issue · matplotlib/matplotlib
Description: matplotlib: plotting with Python. Contribute to matplotlib/matplotlib development by creating an account on GitHub.
Open Graph Description: matplotlib: plotting with Python. Contribute to matplotlib/matplotlib development by creating an account on GitHub.
X Description: matplotlib: plotting with Python. Contribute to matplotlib/matplotlib development by creating an account on GitHub.
Opengraph URL: https://github.com/matplotlib/matplotlib
X: @github
Domain: github.com
{"@context":"https://schema.org","@type":"DiscussionForumPosting","headline":"[Bug]: Horizontal colorbars drawn incorrectly with hatches","articleBody":"### Bug summary\n\nWhen specifying hatches for `contourf,` the colorbar is drawn correctly for vertical colorbars but not for horizontal ones. The Hatches and colorfill only fill the lower diagonal of the colorbar boxes.\n\n### Code for reproduction\n\n```python\nimport matplotlib.pyplot as plt\r\nimport numpy as np\r\n\r\nimport matplotlib.pyplot as plt\r\nimport numpy as np\r\n\r\n# invent some numbers, turning the x and y arrays into simple\r\n# 2d arrays, which make combining them together easier.\r\nx = np.linspace(-3, 5, 150).reshape(1, -1)\r\ny = np.linspace(-3, 5, 120).reshape(-1, 1)\r\nz = np.cos(x) + np.sin(y)\r\n\r\n# we no longer need x and y to be 2 dimensional, so flatten them.\r\nx, y = x.flatten(), y.flatten()\r\n\r\nfig1, ax1 = plt.subplots()\r\ncs = ax1.contourf(x, y, z, hatches=['-', '/', '\\\\', '//'],\r\n cmap='gray', extend='both', alpha=0.5)\r\n\r\nfig1.colorbar(cs, orientation='horizontal')\r\nplt.show()\n```\n\n\n### Actual outcome\n\n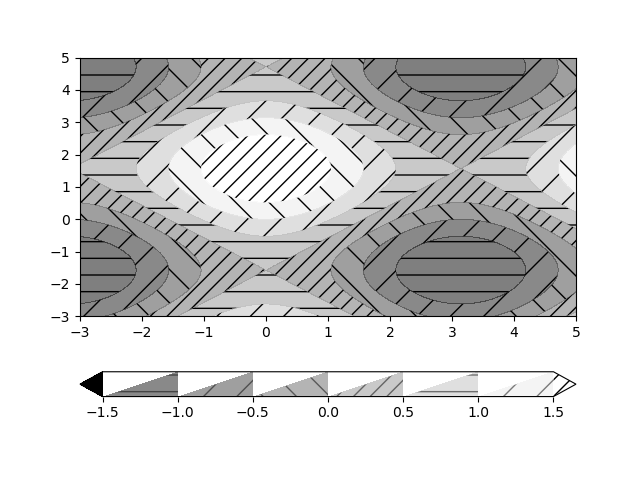\r\n\n\n### Expected outcome\n\n\r\n\n\n### Additional information\n\nThe bug occurs when the colorbar is horizontal and the `contourf` call uses hatches. Changing the kwargs `extend`, `cmap`, `colors`, `alpha`, etc when calling `contourf` does *not* resolve the bug. \r\n\r\nThe bug does *not* occur when the colorbar is vertical with hatches nor when the colorbar is horizontal and no hatches are used.\r\n\r\n*Potential Solution*:\r\nIn colorbar.py, change line 637 to the following:\r\n`xy = np.array([[X[i, 0], Y[i, 1]],`\r\n\r\nThis doesn't cause issues when hatches are not used. It also doesn't cause problems with vertical colorbars.\n\n### Operating system\n\nmacOS Big Sur Version 11.3.1 with Intel Silicon\n\n### Matplotlib Version\n\n3.5.2\n\n### Matplotlib Backend\n\nmodule://backend_interagg\n\n### Python version\n\n3.10.5\n\n### Jupyter version\n\n_No response_\n\n### Installation\n\nconda","author":{"url":"https://github.com/hCraker","@type":"Person","name":"hCraker"},"datePublished":"2022-07-20T20:41:26.000Z","interactionStatistic":{"@type":"InteractionCounter","interactionType":"https://schema.org/CommentAction","userInteractionCount":8},"url":"https://github.com/23456/matplotlib/issues/23456"}| route-pattern | /:user_id/:repository/issues/:id(.:format) |
| route-controller | issues |
| route-action | show |
| fetch-nonce | v2:7c778541-de2c-4d37-3f8d-cfe516aaddd1 |
| current-catalog-service-hash | 81bb79d38c15960b92d99bca9288a9108c7a47b18f2423d0f6438c5b7bcd2114 |
| request-id | E010:1F16:6BAD204:99217D3:6A51050B |
| html-safe-nonce | 45c8a681d7164e7cb8bea61466406e5e5e9cf366fcbce60dcb15fd049c0c184f |
| visitor-payload | eyJyZWZlcnJlciI6IiIsInJlcXVlc3RfaWQiOiJFMDEwOjFGMTY6NkJBRDIwNDo5OTIxN0QzOjZBNTEwNTBCIiwidmlzaXRvcl9pZCI6IjYzMjk3MjIwNjg3NDE5ODE0NTEiLCJyZWdpb25fZWRnZSI6ImlhZCIsInJlZ2lvbl9yZW5kZXIiOiJpYWQifQ== |
| visitor-hmac | e6f99ea78a602a824c38ccee0e5ecc406d59455032f79e41584108ce26a7fe01 |
| hovercard-subject-tag | repository:1385122 |
| github-keyboard-shortcuts | repository,issues,copilot |
| google-site-verification | Apib7-x98H0j5cPqHWwSMm6dNU4GmODRoqxLiDzdx9I |
| octolytics-url | https://collector.github.com/github/collect |
| analytics-location | / |
| fb:app_id | 1401488693436528 |
| apple-itunes-app | app-id=1477376905, app-argument=https://github.com/matplotlib/matplotlib/issues/23456 |
| twitter:image | https://opengraph.githubassets.com/71df57b45279fb48f14f38101838216990f40b6e663ac9ba1a234f023245d9b5/matplotlib/matplotlib |
| twitter:card | summary_large_image |
| og:image | https://opengraph.githubassets.com/71df57b45279fb48f14f38101838216990f40b6e663ac9ba1a234f023245d9b5/matplotlib/matplotlib |
| og:image:alt | matplotlib: plotting with Python. Contribute to matplotlib/matplotlib development by creating an account on GitHub. |
| og:image:width | 1200 |
| og:image:height | 600 |
| og:site_name | GitHub |
| og:type | object |
| hostname | github.com |
| expected-hostname | github.com |
| None | 38906a4da4e3e9fd88dfeacee232f5932c0c5f7495de3b4efc53ddfac7173d12 |
| turbo-cache-control | no-cache |
| go-import | github.com/matplotlib/matplotlib git https://github.com/matplotlib/matplotlib.git |
| octolytics-dimension-user_id | 215947 |
| octolytics-dimension-user_login | matplotlib |
| octolytics-dimension-repository_id | 1385122 |
| octolytics-dimension-repository_nwo | matplotlib/matplotlib |
| octolytics-dimension-repository_public | true |
| octolytics-dimension-repository_is_fork | false |
| octolytics-dimension-repository_network_root_id | 1385122 |
| octolytics-dimension-repository_network_root_nwo | matplotlib/matplotlib |
| turbo-body-classes | logged-out env-production page-responsive |
| disable-turbo | false |
| browser-stats-url | https://api.github.com/_private/browser/stats |
| browser-errors-url | https://api.github.com/_private/browser/errors |
| release | 90441ea9b98e7491aa6ebcd135fccce4e2396f48 |
| ui-target | full |
| theme-color | #1e2327 |
| color-scheme | light dark |
Links:
Viewport: width=device-width

