Title: [Bug]: Colorbar with log scales wrong format · Issue #23389 · matplotlib/matplotlib · GitHub
Open Graph Title: [Bug]: Colorbar with log scales wrong format · Issue #23389 · matplotlib/matplotlib
X Title: [Bug]: Colorbar with log scales wrong format · Issue #23389 · matplotlib/matplotlib
Description: Bug summary The colour bar ticks are weirdly formatted when using a logarithmic scale when using version 3.5.0 or later. Code for reproduction Taken from https://matplotlib.org/stable/gallery/images_contours_and_fields/contourf_log.html ...
Open Graph Description: Bug summary The colour bar ticks are weirdly formatted when using a logarithmic scale when using version 3.5.0 or later. Code for reproduction Taken from https://matplotlib.org/stable/gallery/image...
X Description: Bug summary The colour bar ticks are weirdly formatted when using a logarithmic scale when using version 3.5.0 or later. Code for reproduction Taken from https://matplotlib.org/stable/gallery/image...
Opengraph URL: https://github.com/matplotlib/matplotlib/issues/23389
X: @github
Domain: github.com
{"@context":"https://schema.org","@type":"DiscussionForumPosting","headline":"[Bug]: Colorbar with log scales wrong format","articleBody":"### Bug summary\n\nThe colour bar ticks are weirdly formatted when using a logarithmic scale when using version 3.5.0 or later.\n\n### Code for reproduction\n\n```python\nTaken from https://matplotlib.org/stable/gallery/images_contours_and_fields/contourf_log.html\r\n\r\n\r\nimport matplotlib.pyplot as plt\r\nimport numpy as np\r\nfrom numpy import ma\r\nfrom matplotlib import ticker, cm\r\n\r\nN = 100\r\nx = np.linspace(-3.0, 3.0, N)\r\ny = np.linspace(-2.0, 2.0, N)\r\n\r\nX, Y = np.meshgrid(x, y)\r\n\r\n# A low hump with a spike coming out.\r\n# Needs to have z/colour axis on a log scale so we see both hump and spike.\r\n# linear scale only shows the spike.\r\nZ1 = np.exp(-X**2 - Y**2)\r\nZ2 = np.exp(-(X * 10)**2 - (Y * 10)**2)\r\nz = Z1 + 50 * Z2\r\n\r\n# Put in some negative values (lower left corner) to cause trouble with logs:\r\nz[:5, :5] = -1\r\n\r\n# The following is not strictly essential, but it will eliminate\r\n# a warning. Comment it out to see the warning.\r\nz = ma.masked_where(z \u003c= 0, z)\r\n\r\n\r\n# Automatic selection of levels works; setting the\r\n# log locator tells contourf to use a log scale:\r\nfig, ax = plt.subplots()\r\ncs = ax.contourf(X, Y, z, locator=ticker.LogLocator(), cmap=cm.PuBu_r)\r\n\r\ncbar = fig.colorbar(cs)\r\n\r\nplt.show()\n```\n\n\n### Actual outcome\n\n\r\n\n\n### Expected outcome\n\nRunning the exact same code on 3.4.2 produces the expected behaviour\r\n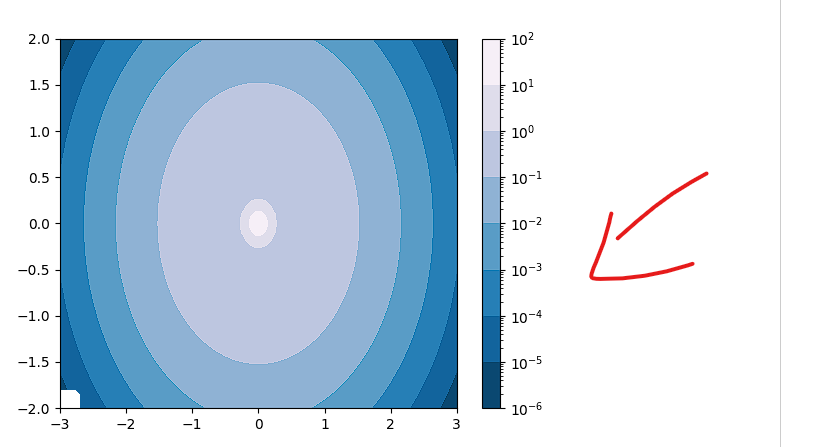\r\n\n\n### Additional information\n\nThis worked perfectly on version 3.4.2\n\n### Operating system\n\nWindows\n\n### Matplotlib Version\n\n\u003e3.5.0\n\n### Matplotlib Backend\n\n_No response_\n\n### Python version\n\n_No response_\n\n### Jupyter version\n\n_No response_\n\n### Installation\n\npip","author":{"url":"https://github.com/RemDelaporteMathurin","@type":"Person","name":"RemDelaporteMathurin"},"datePublished":"2022-07-05T14:12:30.000Z","interactionStatistic":{"@type":"InteractionCounter","interactionType":"https://schema.org/CommentAction","userInteractionCount":7},"url":"https://github.com/23389/matplotlib/issues/23389"}| route-pattern | /_view_fragments/issues/show/:user_id/:repository/:id/issue_layout(.:format) |
| route-controller | voltron_issues_fragments |
| route-action | issue_layout |
| fetch-nonce | v2:59474edd-220f-a911-ac44-03f67b8bbf4e |
| current-catalog-service-hash | 81bb79d38c15960b92d99bca9288a9108c7a47b18f2423d0f6438c5b7bcd2114 |
| request-id | C558:13EE66:1851FC7:22B6612:6A50D4DD |
| html-safe-nonce | 7d321c53d3c3b89bebdfa9d2e092a41a2730ceef487ec4e80924bc3c8ad6f657 |
| visitor-payload | eyJyZWZlcnJlciI6IiIsInJlcXVlc3RfaWQiOiJDNTU4OjEzRUU2NjoxODUxRkM3OjIyQjY2MTI6NkE1MEQ0REQiLCJ2aXNpdG9yX2lkIjoiNzA1NTIwMjM5NzkxNjgxMjUwOSIsInJlZ2lvbl9lZGdlIjoiaWFkIiwicmVnaW9uX3JlbmRlciI6ImlhZCJ9 |
| visitor-hmac | 12d3042ff1ce4bc95035d4b8505989b0d27357ebf630f1a2ca158a0f3bf97bff |
| hovercard-subject-tag | issue:1294360601 |
| github-keyboard-shortcuts | repository,issues,copilot |
| google-site-verification | Apib7-x98H0j5cPqHWwSMm6dNU4GmODRoqxLiDzdx9I |
| octolytics-url | https://collector.github.com/github/collect |
| analytics-location | / |
| fb:app_id | 1401488693436528 |
| apple-itunes-app | app-id=1477376905, app-argument=https://github.com/_view_fragments/issues/show/matplotlib/matplotlib/23389/issue_layout |
| twitter:image | https://opengraph.githubassets.com/c1b82d6489e8c4038fce71dc5eb0193472edada5558e3739bbb7be88d0467bf6/matplotlib/matplotlib/issues/23389 |
| twitter:card | summary_large_image |
| og:image | https://opengraph.githubassets.com/c1b82d6489e8c4038fce71dc5eb0193472edada5558e3739bbb7be88d0467bf6/matplotlib/matplotlib/issues/23389 |
| og:image:alt | Bug summary The colour bar ticks are weirdly formatted when using a logarithmic scale when using version 3.5.0 or later. Code for reproduction Taken from https://matplotlib.org/stable/gallery/image... |
| og:image:width | 1200 |
| og:image:height | 600 |
| og:site_name | GitHub |
| og:type | object |
| og:author:username | RemDelaporteMathurin |
| hostname | github.com |
| expected-hostname | github.com |
| None | 72b13e0e8d0319acdd27a145cfe73f4f06c791713d0ac4690e41fb68ad28cac0 |
| turbo-cache-control | no-preview |
| go-import | github.com/matplotlib/matplotlib git https://github.com/matplotlib/matplotlib.git |
| octolytics-dimension-user_id | 215947 |
| octolytics-dimension-user_login | matplotlib |
| octolytics-dimension-repository_id | 1385122 |
| octolytics-dimension-repository_nwo | matplotlib/matplotlib |
| octolytics-dimension-repository_public | true |
| octolytics-dimension-repository_is_fork | false |
| octolytics-dimension-repository_network_root_id | 1385122 |
| octolytics-dimension-repository_network_root_nwo | matplotlib/matplotlib |
| turbo-body-classes | logged-out env-production page-responsive |
| disable-turbo | false |
| browser-stats-url | https://api.github.com/_private/browser/stats |
| browser-errors-url | https://api.github.com/_private/browser/errors |
| release | 5bf72d88d55658ca72495ccb034c76af6c4c2feb |
| ui-target | full |
| theme-color | #1e2327 |
| color-scheme | light dark |
Links:
Viewport: width=device-width

