Title: [Bug]: 3d mouse coords values reported in toolbar are meaningless · Issue #22775 · matplotlib/matplotlib · GitHub
Open Graph Title: [Bug]: 3d mouse coords values reported in toolbar are meaningless · Issue #22775 · matplotlib/matplotlib
X Title: [Bug]: 3d mouse coords values reported in toolbar are meaningless · Issue #22775 · matplotlib/matplotlib
Description: Bug summary The mouse coords reported for 3D axes are meaningless (they correspond to some arbitrarily chosen depth). In fact, I do not believe there's any canonical way to choose the values displayed. See discussion starting at #22624 (...
Open Graph Description: Bug summary The mouse coords reported for 3D axes are meaningless (they correspond to some arbitrarily chosen depth). In fact, I do not believe there's any canonical way to choose the values displa...
X Description: Bug summary The mouse coords reported for 3D axes are meaningless (they correspond to some arbitrarily chosen depth). In fact, I do not believe there's any canonical way to choose the values di...
Opengraph URL: https://github.com/matplotlib/matplotlib/issues/22775
X: @github
Domain: github.com
{"@context":"https://schema.org","@type":"DiscussionForumPosting","headline":"[Bug]: 3d mouse coords values reported in toolbar are meaningless","articleBody":"### Bug summary\n\nThe mouse coords reported for 3D axes are meaningless (they correspond to some arbitrarily chosen depth). In fact, I do not believe there's any canonical way to choose the values displayed. See discussion starting at https://github.com/matplotlib/matplotlib/issues/22624#issuecomment-1063945593.\n\n### Code for reproduction\n\n```python\n# xyz values printed when dragging the mouse across window (default 3d view) horizontally,\r\n# along the middle y position:\r\nfrom pylab import *\r\nfrom matplotlib.backend_bases import LocationEvent\r\nrcdefaults(); rcParams[\"axes.unicode_minus\"] = False # use ascii minus\r\nfig = figure()\r\nax = fig.add_subplot(projection=\"3d\")\r\nfig.canvas.draw()\r\nxyzs = []\r\nscreen_ry = .5\r\n# drag mouse across window horizontally, along the middle y position\r\nfor screen_rx in np.linspace(0, 1, 1001):\r\n screen_xy = fig.transFigure.transform((screen_rx, screen_ry))\r\n pseudo_xy = ax.transData.inverted().transform(screen_xy)\r\n ev = LocationEvent(\"\", fig.canvas, *screen_xy)\r\n ev.xdata, ev.ydata = pseudo_xy\r\n if any([axis.pane.contains(ev)[0] for axis in ax._axis_map.values()]):\r\n s = ax.format_coord(*pseudo_xy) # formatted string\r\n xyzs.append([float(part.split(\"=\")[1]) for part in s.split(\",\")]) # displayed xyz\r\n else: # out of Axes\r\n xyzs.append((np.nan, np.nan, np.nan))\r\nxyzs = array(xyzs)\r\nclose(fig)\r\nplot(xyzs[:, 0], label=\"x\")\r\nplot(xyzs[:, 1], label=\"y\")\r\nplot(xyzs[:, 2], label=\"z\")\r\nlegend()\r\nshow()\n```\n\n\n### Actual outcome\n\n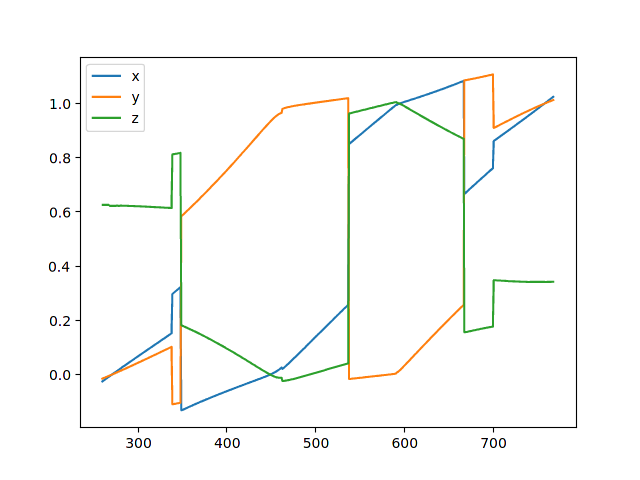\r\n\n\n### Expected outcome\n\nDon't try to display meaningless values.\n\n### Additional information\n\n_No response_\n\n### Operating system\n\narch linux\n\n### Matplotlib Version\n\n3.6.0.dev1926+gf670fe7879\n\n### Matplotlib Backend\n\nmplcairo\n\n### Python version\n\n3.10\n\n### Jupyter version\n\nENOSUCHLIB\n\n### Installation\n\ngit checkout","author":{"url":"https://github.com/anntzer","@type":"Person","name":"anntzer"},"datePublished":"2022-04-03T18:06:15.000Z","interactionStatistic":{"@type":"InteractionCounter","interactionType":"https://schema.org/CommentAction","userInteractionCount":2},"url":"https://github.com/22775/matplotlib/issues/22775"}| route-pattern | /_view_fragments/issues/show/:user_id/:repository/:id/issue_layout(.:format) |
| route-controller | voltron_issues_fragments |
| route-action | issue_layout |
| fetch-nonce | v2:b4c35b4b-0dc9-c043-c9e6-2c80f0e8009b |
| current-catalog-service-hash | 81bb79d38c15960b92d99bca9288a9108c7a47b18f2423d0f6438c5b7bcd2114 |
| request-id | DCC6:28AF9F:4086E3:5B6EDC:6A5485DA |
| html-safe-nonce | f5b6589722066ee1ae22b5c5d4d693df54b8f139a71f211ee275bd498426dee5 |
| visitor-payload | eyJyZWZlcnJlciI6IiIsInJlcXVlc3RfaWQiOiJEQ0M2OjI4QUY5Rjo0MDg2RTM6NUI2RURDOjZBNTQ4NURBIiwidmlzaXRvcl9pZCI6IjIyMzExNzA4ODU2ODMwMjEyNzQiLCJyZWdpb25fZWRnZSI6ImlhZCIsInJlZ2lvbl9yZW5kZXIiOiJpYWQifQ== |
| visitor-hmac | 12f5642617ac7a58230bc80f7d1b85a59af96f3428dc297f931759ed5bfffba1 |
| hovercard-subject-tag | issue:1191002637 |
| github-keyboard-shortcuts | repository,issues,copilot |
| google-site-verification | Apib7-x98H0j5cPqHWwSMm6dNU4GmODRoqxLiDzdx9I |
| octolytics-url | https://collector.github.com/github/collect |
| analytics-location | / |
| fb:app_id | 1401488693436528 |
| apple-itunes-app | app-id=1477376905, app-argument=https://github.com/_view_fragments/issues/show/matplotlib/matplotlib/22775/issue_layout |
| twitter:image | https://opengraph.githubassets.com/a31d9121421d48ff60fda3151aea2c1ea907bc26051258ecac8fd30b0bc07f19/matplotlib/matplotlib/issues/22775 |
| twitter:card | summary_large_image |
| og:image | https://opengraph.githubassets.com/a31d9121421d48ff60fda3151aea2c1ea907bc26051258ecac8fd30b0bc07f19/matplotlib/matplotlib/issues/22775 |
| og:image:alt | Bug summary The mouse coords reported for 3D axes are meaningless (they correspond to some arbitrarily chosen depth). In fact, I do not believe there's any canonical way to choose the values displa... |
| og:image:width | 1200 |
| og:image:height | 600 |
| og:site_name | GitHub |
| og:type | object |
| og:author:username | anntzer |
| hostname | github.com |
| expected-hostname | github.com |
| None | b9a586c06a05a7a86fc7e3f4dbd03e42f6869085879aa184aa6369456dbd50fb |
| turbo-cache-control | no-preview |
| go-import | github.com/matplotlib/matplotlib git https://github.com/matplotlib/matplotlib.git |
| octolytics-dimension-user_id | 215947 |
| octolytics-dimension-user_login | matplotlib |
| octolytics-dimension-repository_id | 1385122 |
| octolytics-dimension-repository_nwo | matplotlib/matplotlib |
| octolytics-dimension-repository_public | true |
| octolytics-dimension-repository_is_fork | false |
| octolytics-dimension-repository_network_root_id | 1385122 |
| octolytics-dimension-repository_network_root_nwo | matplotlib/matplotlib |
| turbo-body-classes | logged-out env-production page-responsive |
| disable-turbo | false |
| browser-stats-url | https://api.github.com/_private/browser/stats |
| browser-errors-url | https://api.github.com/_private/browser/errors |
| release | 03ccb116376fd46e8ba2a4cdc541e35f13f70734 |
| ui-target | canary-2 |
| theme-color | #1e2327 |
| color-scheme | light dark |
Links:
Viewport: width=device-width
