Title: [Doc]: Example for "Scale invariant angle label" does not scale the arc correctly · Issue #22392 · matplotlib/matplotlib · GitHub
Open Graph Title: [Doc]: Example for "Scale invariant angle label" does not scale the arc correctly · Issue #22392 · matplotlib/matplotlib
X Title: [Doc]: Example for "Scale invariant angle label" does not scale the arc correctly · Issue #22392 · matplotlib/matplotlib
Description: Bug summary When setting a dpi value and using unit = 'points' in the AngleAnnotation example class, it does not scale the Arc width and height correctly. I will use the example from the link above to show the problem: Code for reproduct...
Open Graph Description: Bug summary When setting a dpi value and using unit = 'points' in the AngleAnnotation example class, it does not scale the Arc width and height correctly. I will use the example from the link above...
X Description: Bug summary When setting a dpi value and using unit = 'points' in the AngleAnnotation example class, it does not scale the Arc width and height correctly. I will use the example from the li...
Opengraph URL: https://github.com/matplotlib/matplotlib/issues/22392
X: @github
Domain: github.com
{"@context":"https://schema.org","@type":"DiscussionForumPosting","headline":"[Doc]: Example for \"Scale invariant angle label\" does not scale the arc correctly","articleBody":"### Bug summary\r\n\r\nWhen setting a dpi value and using `unit = 'points'` in the [AngleAnnotation](https://matplotlib.org/devdocs/gallery/text_labels_and_annotations/angle_annotation.html#angleannotation-class) example class, it does not scale the Arc width and height correctly. I will use the example from the link above to show the problem:\r\n\r\n### Code for reproduction\r\n\r\n```python\r\nfig, ax = plt.subplots(dpi=300)\r\nfig.canvas.draw() # Need to draw the figure to define renderer\r\nax.set_title(\"AngleLabel example\")\r\n\r\n# Plot two crossing lines and label each angle between them with the above\r\n# ``AngleAnnotation`` tool.\r\ncenter = (4.5, 650)\r\np1 = [(2.5, 710), (6.0, 605)]\r\np2 = [(3.0, 275), (5.5, 900)]\r\nline1, = ax.plot(*zip(*p1))\r\nline2, = ax.plot(*zip(*p2))\r\npoint, = ax.plot(*center, marker=\"o\")\r\n\r\nam1 = AngleAnnotation(center, p1[1], p2[1], ax=ax, size=75, text=r\"$\\alpha$\")\r\nam2 = AngleAnnotation(center, p2[1], p1[0], ax=ax, size=35, text=r\"$\\beta$\")\r\nam3 = AngleAnnotation(center, p1[0], p2[0], ax=ax, size=75, text=r\"$\\gamma$\")\r\nam4 = AngleAnnotation(center, p2[0], p1[1], ax=ax, size=35, text=r\"$\\theta$\")\r\n\r\n\r\n# Showcase some styling options for the angle arc, as well as the text.\r\np = [(6.0, 400), (5.3, 410), (5.6, 300)]\r\nax.plot(*zip(*p))\r\nam5 = AngleAnnotation(p[1], p[0], p[2], ax=ax, size=40, text=r\"$\\Phi$\",\r\n linestyle=\"--\", color=\"gray\", textposition=\"outside\",\r\n text_kw=dict(fontsize=16, color=\"gray\"))\r\nplt.show()\r\n```\r\n\r\n\r\n### Actual outcome\r\n\r\n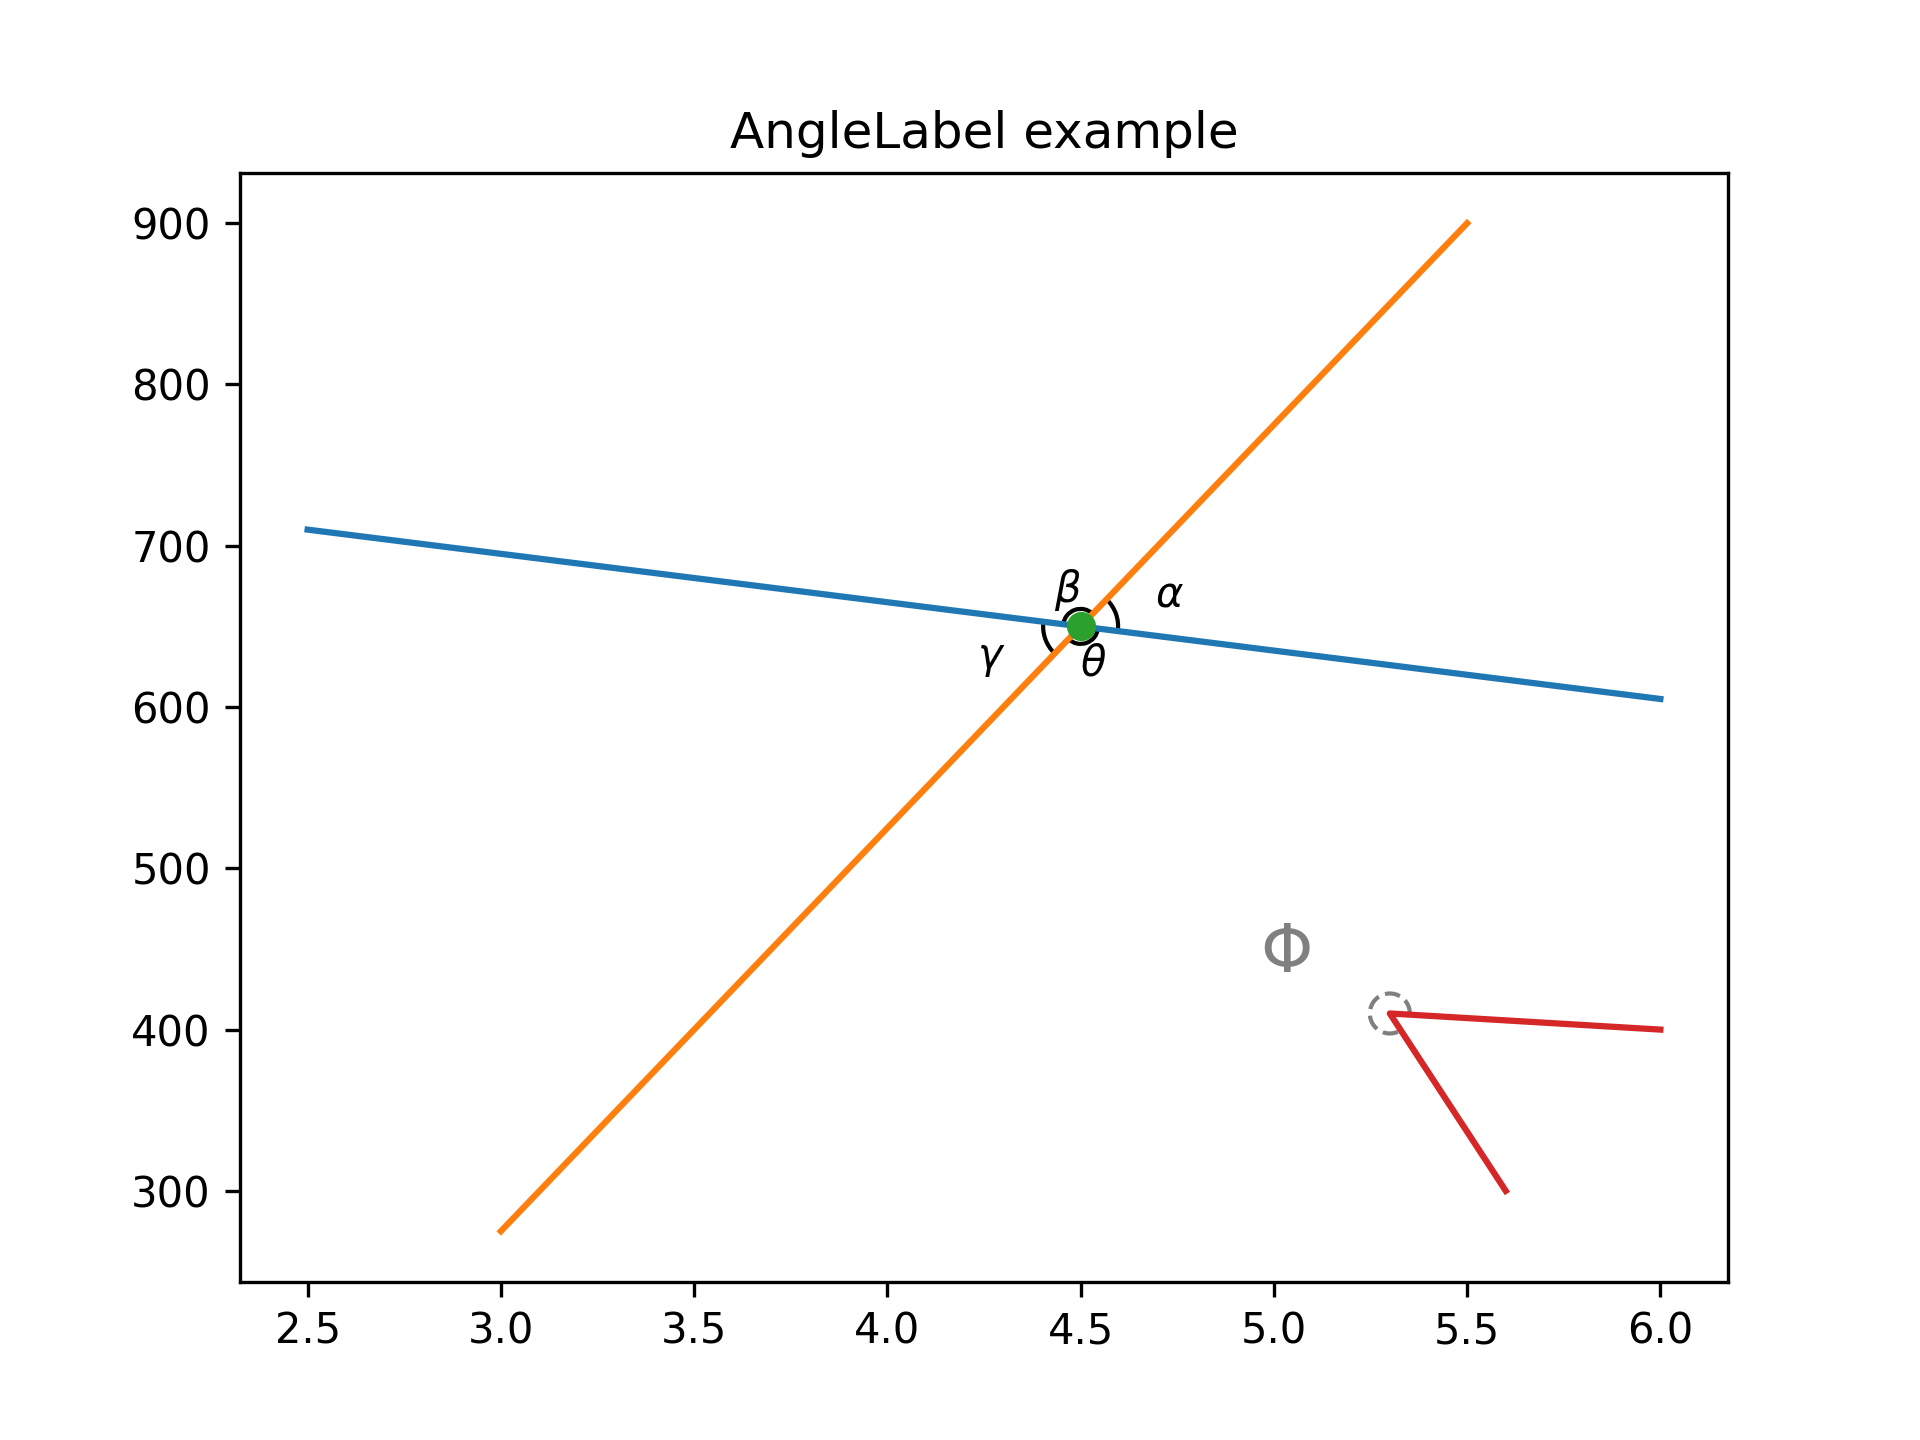\r\n\r\n\r\n### Expected outcome\r\n\r\n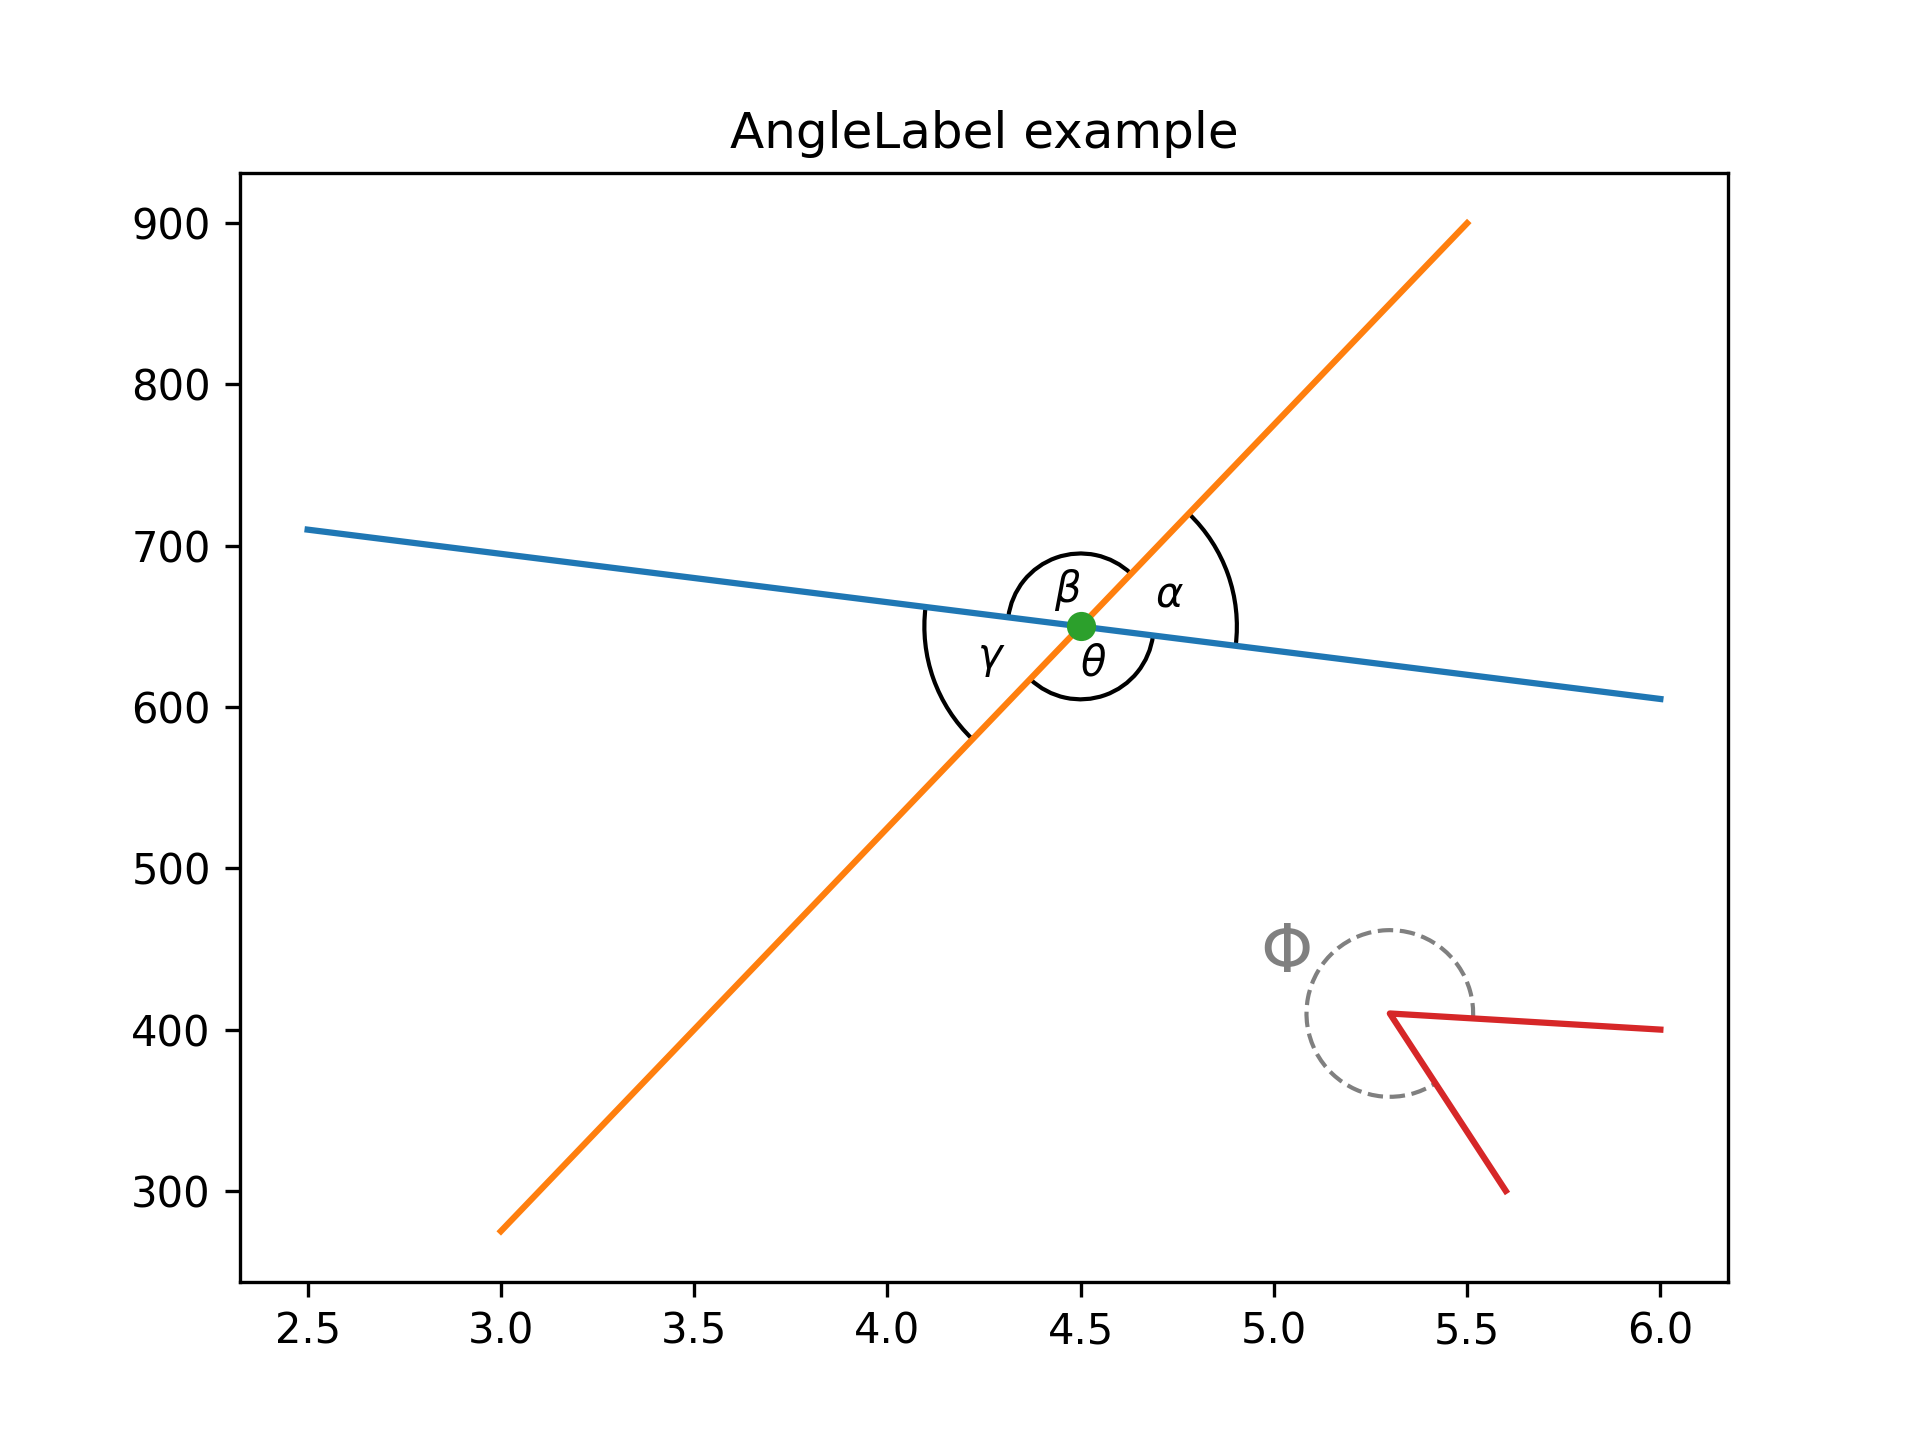\r\n\r\nThe expected outcome can be produced when changing `size` to `get_size()` in the Arc initialisation.\r\n\r\n```python\r\nsuper().__init__(self._xydata, self.get_size(), self.get_size(), angle=0.0,\r\n theta1=self.theta1, theta2=self.theta2, **kwargs)\r\n```\r\n\r\n### Additional information\r\n\r\n_No response_\r\n\r\n### Operating system\r\n\r\n_No response_\r\n\r\n### Matplotlib Version\r\n\r\n3.5.1\r\n\r\n### Matplotlib Backend\r\n\r\n_No response_\r\n\r\n### Python version\r\n\r\n_No response_\r\n\r\n### Jupyter version\r\n\r\n_No response_\r\n\r\n### Installation\r\n\r\n_No response_","author":{"url":"https://github.com/wayofsamu","@type":"Person","name":"wayofsamu"},"datePublished":"2022-02-04T10:50:43.000Z","interactionStatistic":{"@type":"InteractionCounter","interactionType":"https://schema.org/CommentAction","userInteractionCount":4},"url":"https://github.com/22392/matplotlib/issues/22392"}| route-pattern | /_view_fragments/issues/show/:user_id/:repository/:id/issue_layout(.:format) |
| route-controller | voltron_issues_fragments |
| route-action | issue_layout |
| fetch-nonce | v2:875c82f2-e2e2-dd4a-1998-7f1325387a60 |
| current-catalog-service-hash | 81bb79d38c15960b92d99bca9288a9108c7a47b18f2423d0f6438c5b7bcd2114 |
| request-id | B198:31D6B3:45976:5D972:6A51CA23 |
| html-safe-nonce | de26698ff6444efebdbbf952949899a6bf19c842748e10181d559d4b58b34397 |
| visitor-payload | eyJyZWZlcnJlciI6IiIsInJlcXVlc3RfaWQiOiJCMTk4OjMxRDZCMzo0NTk3Njo1RDk3Mjo2QTUxQ0EyMyIsInZpc2l0b3JfaWQiOiIxOTQwOTY0NDIwODQ4MDQ0NTc5IiwicmVnaW9uX2VkZ2UiOiJpYWQiLCJyZWdpb25fcmVuZGVyIjoiaWFkIn0= |
| visitor-hmac | 639c77ae30c123ba82f8f404ee1f652f7718808f0f46d4775eff26d066ac8fbf |
| hovercard-subject-tag | issue:1124064035 |
| github-keyboard-shortcuts | repository,issues,copilot |
| google-site-verification | Apib7-x98H0j5cPqHWwSMm6dNU4GmODRoqxLiDzdx9I |
| octolytics-url | https://collector.github.com/github/collect |
| analytics-location | / |
| fb:app_id | 1401488693436528 |
| apple-itunes-app | app-id=1477376905, app-argument=https://github.com/_view_fragments/issues/show/matplotlib/matplotlib/22392/issue_layout |
| twitter:image | https://opengraph.githubassets.com/28b8f432cb6b059cf22162a351d4c0c6bd8062c65b80bed9c023d2c5bb0c565b/matplotlib/matplotlib/issues/22392 |
| twitter:card | summary_large_image |
| og:image | https://opengraph.githubassets.com/28b8f432cb6b059cf22162a351d4c0c6bd8062c65b80bed9c023d2c5bb0c565b/matplotlib/matplotlib/issues/22392 |
| og:image:alt | Bug summary When setting a dpi value and using unit = 'points' in the AngleAnnotation example class, it does not scale the Arc width and height correctly. I will use the example from the link above... |
| og:image:width | 1200 |
| og:image:height | 600 |
| og:site_name | GitHub |
| og:type | object |
| og:author:username | wayofsamu |
| hostname | github.com |
| expected-hostname | github.com |
| None | b9a586c06a05a7a86fc7e3f4dbd03e42f6869085879aa184aa6369456dbd50fb |
| turbo-cache-control | no-preview |
| go-import | github.com/matplotlib/matplotlib git https://github.com/matplotlib/matplotlib.git |
| octolytics-dimension-user_id | 215947 |
| octolytics-dimension-user_login | matplotlib |
| octolytics-dimension-repository_id | 1385122 |
| octolytics-dimension-repository_nwo | matplotlib/matplotlib |
| octolytics-dimension-repository_public | true |
| octolytics-dimension-repository_is_fork | false |
| octolytics-dimension-repository_network_root_id | 1385122 |
| octolytics-dimension-repository_network_root_nwo | matplotlib/matplotlib |
| turbo-body-classes | logged-out env-production page-responsive |
| disable-turbo | false |
| browser-stats-url | https://api.github.com/_private/browser/stats |
| browser-errors-url | https://api.github.com/_private/browser/errors |
| release | 7aed05249554b889eb33d002851a973eebcc7e91 |
| ui-target | canary-2 |
| theme-color | #1e2327 |
| color-scheme | light dark |
Links:
Viewport: width=device-width

