Title: [Bug]: Wrong position of exponent label for extended colorbar · Issue #22312 · matplotlib/matplotlib · GitHub
Open Graph Title: [Bug]: Wrong position of exponent label for extended colorbar · Issue #22312 · matplotlib/matplotlib
X Title: [Bug]: Wrong position of exponent label for extended colorbar · Issue #22312 · matplotlib/matplotlib
Description: Bug summary The position of exponent label is wrong for the extended colorbar when the colorbar location is left or right. Code for reproduction import matplotlib.pyplot as plt import numpy as np N = 18 state = np.random.RandomState(5142...
Open Graph Description: Bug summary The position of exponent label is wrong for the extended colorbar when the colorbar location is left or right. Code for reproduction import matplotlib.pyplot as plt import numpy as np N...
X Description: Bug summary The position of exponent label is wrong for the extended colorbar when the colorbar location is left or right. Code for reproduction import matplotlib.pyplot as plt import numpy as np N...
Opengraph URL: https://github.com/matplotlib/matplotlib/issues/22312
X: @github
Domain: github.com
{"@context":"https://schema.org","@type":"DiscussionForumPosting","headline":"[Bug]: Wrong position of exponent label for extended colorbar","articleBody":"### Bug summary\n\nThe position of exponent label is wrong for the extended colorbar when the colorbar location is left or right.\n\n### Code for reproduction\n\n```python\nimport matplotlib.pyplot as plt\r\nimport numpy as np\r\n\r\nN = 18\r\nstate = np.random.RandomState(51423)\r\ndata = 1e5 * np.cumsum(state.rand(N, N), axis=0)\r\nfig, ax = plt.subplots()\r\nm = ax.pcolor(data)\r\nfig.colorbar(m, ax=ax, extend='max', location='right')\r\nfig.colorbar(m, ax=ax, extend='max', location='left')\n```\n\n\n### Actual outcome\n\n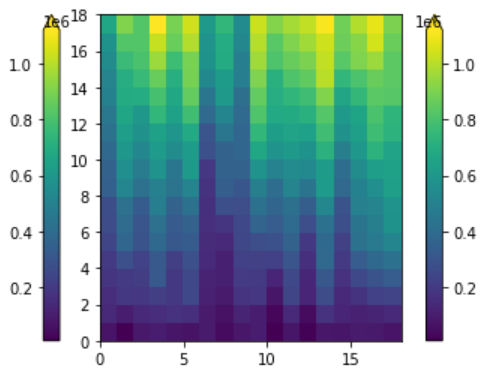\r\n\n\n### Expected outcome\n\nLike V3.4.3\r\n\r\n\r\n\n\n### Additional information\n\n_No response_\n\n### Operating system\n\n_No response_\n\n### Matplotlib Version\n\n3.5.1\n\n### Matplotlib Backend\n\n_No response_\n\n### Python version\n\n_No response_\n\n### Jupyter version\n\n_No response_\n\n### Installation\n\nconda","author":{"url":"https://github.com/zxdawn","@type":"Person","name":"zxdawn"},"datePublished":"2022-01-25T08:15:34.000Z","interactionStatistic":{"@type":"InteractionCounter","interactionType":"https://schema.org/CommentAction","userInteractionCount":2},"url":"https://github.com/22312/matplotlib/issues/22312"}| route-pattern | /_view_fragments/issues/show/:user_id/:repository/:id/issue_layout(.:format) |
| route-controller | voltron_issues_fragments |
| route-action | issue_layout |
| fetch-nonce | v2:9aee1e04-9670-11b9-f31c-fa3b4ee2101c |
| current-catalog-service-hash | 81bb79d38c15960b92d99bca9288a9108c7a47b18f2423d0f6438c5b7bcd2114 |
| request-id | B010:278EE8:2CE018:3C368C:6A528BFE |
| html-safe-nonce | 77485953fd4b87352404d8cf05425c8483a7bae8ac5754086fa9abef0e889832 |
| visitor-payload | eyJyZWZlcnJlciI6IiIsInJlcXVlc3RfaWQiOiJCMDEwOjI3OEVFODoyQ0UwMTg6M0MzNjhDOjZBNTI4QkZFIiwidmlzaXRvcl9pZCI6Ijg3ODM5NTU3NjQyNDA4Nzg1OTEiLCJyZWdpb25fZWRnZSI6ImlhZCIsInJlZ2lvbl9yZW5kZXIiOiJpYWQifQ== |
| visitor-hmac | 096b29f0a37727723b6a12b66e0d79cb9ea7b37dd12c0d37cdf7040a21df81c5 |
| hovercard-subject-tag | issue:1113560476 |
| github-keyboard-shortcuts | repository,issues,copilot |
| google-site-verification | Apib7-x98H0j5cPqHWwSMm6dNU4GmODRoqxLiDzdx9I |
| octolytics-url | https://collector.github.com/github/collect |
| analytics-location | / |
| fb:app_id | 1401488693436528 |
| apple-itunes-app | app-id=1477376905, app-argument=https://github.com/_view_fragments/issues/show/matplotlib/matplotlib/22312/issue_layout |
| twitter:image | https://opengraph.githubassets.com/04f1375510b5a24133e217e0759e80c2914d2c9ee8ab5528bcd3b528433f93d2/matplotlib/matplotlib/issues/22312 |
| twitter:card | summary_large_image |
| og:image | https://opengraph.githubassets.com/04f1375510b5a24133e217e0759e80c2914d2c9ee8ab5528bcd3b528433f93d2/matplotlib/matplotlib/issues/22312 |
| og:image:alt | Bug summary The position of exponent label is wrong for the extended colorbar when the colorbar location is left or right. Code for reproduction import matplotlib.pyplot as plt import numpy as np N... |
| og:image:width | 1200 |
| og:image:height | 600 |
| og:site_name | GitHub |
| og:type | object |
| og:author:username | zxdawn |
| hostname | github.com |
| expected-hostname | github.com |
| None | b9a586c06a05a7a86fc7e3f4dbd03e42f6869085879aa184aa6369456dbd50fb |
| turbo-cache-control | no-preview |
| go-import | github.com/matplotlib/matplotlib git https://github.com/matplotlib/matplotlib.git |
| octolytics-dimension-user_id | 215947 |
| octolytics-dimension-user_login | matplotlib |
| octolytics-dimension-repository_id | 1385122 |
| octolytics-dimension-repository_nwo | matplotlib/matplotlib |
| octolytics-dimension-repository_public | true |
| octolytics-dimension-repository_is_fork | false |
| octolytics-dimension-repository_network_root_id | 1385122 |
| octolytics-dimension-repository_network_root_nwo | matplotlib/matplotlib |
| turbo-body-classes | logged-out env-production page-responsive |
| disable-turbo | false |
| browser-stats-url | https://api.github.com/_private/browser/stats |
| browser-errors-url | https://api.github.com/_private/browser/errors |
| release | 07a982c1d40157c619b364352b704c3ce66bb332 |
| ui-target | full |
| theme-color | #1e2327 |
| color-scheme | light dark |
Links:
Viewport: width=device-width

