Title: [Bug]: TwoSlopeNorm behaves like CenteredNorm · Issue #22197 · matplotlib/matplotlib · GitHub
Open Graph Title: [Bug]: TwoSlopeNorm behaves like CenteredNorm · Issue #22197 · matplotlib/matplotlib
X Title: [Bug]: TwoSlopeNorm behaves like CenteredNorm · Issue #22197 · matplotlib/matplotlib
Description: Bug summary The behavior of TwoSlopeNorm has changed from Colormap Normalization 3.4.0 to Colormap Normalization 3.5.1. See the colorbar being centered and no longer a continuous linear scale. Code for reproduction import numpy as np imp...
Open Graph Description: Bug summary The behavior of TwoSlopeNorm has changed from Colormap Normalization 3.4.0 to Colormap Normalization 3.5.1. See the colorbar being centered and no longer a continuous linear scale. Code...
X Description: Bug summary The behavior of TwoSlopeNorm has changed from Colormap Normalization 3.4.0 to Colormap Normalization 3.5.1. See the colorbar being centered and no longer a continuous linear scale. Code...
Opengraph URL: https://github.com/matplotlib/matplotlib/issues/22197
X: @github
Domain: github.com
{"@context":"https://schema.org","@type":"DiscussionForumPosting","headline":"[Bug]: TwoSlopeNorm behaves like CenteredNorm","articleBody":"### Bug summary\r\n\r\nThe behavior of TwoSlopeNorm has changed from [Colormap Normalization 3.4.0]( https://matplotlib.org/3.4.0/tutorials/colors/colormapnorms.html#twoslopenorm-different-mapping-on-either-side-of-a-center) to [Colormap Normalization 3.5.1]( https://matplotlib.org/stable/tutorials/colors/colormapnorms.html#twoslopenorm-different-mapping-on-either-side-of-a-center). See the colorbar being centered and no longer a continuous linear scale.\r\n\r\n\r\n### Code for reproduction\r\n\r\n```python\r\nimport numpy as np\r\nimport matplotlib.pyplot as plt\r\nimport matplotlib.colors as colors\r\nimport matplotlib.cbook as cbook\r\nfrom matplotlib import cm\r\n\r\ndem = cbook.get_sample_data('topobathy.npz', np_load=True)\r\ntopo = dem['topo']\r\nlongitude = dem['longitude']\r\nlatitude = dem['latitude']\r\n\r\nfig, ax = plt.subplots()\r\n# make a colormap that has land and ocean clearly delineated and of the\r\n# same length (256 + 256)\r\ncolors_undersea = plt.cm.terrain(np.linspace(0, 0.17, 256))\r\ncolors_land = plt.cm.terrain(np.linspace(0.25, 1, 256))\r\nall_colors = np.vstack((colors_undersea, colors_land))\r\nterrain_map = colors.LinearSegmentedColormap.from_list(\r\n 'terrain_map', all_colors)\r\n\r\n# make the norm: Note the center is offset so that the land has more\r\n# dynamic range:\r\ndivnorm = colors.TwoSlopeNorm(vmin=-500., vcenter=0, vmax=4000)\r\n\r\npcm = ax.pcolormesh(longitude, latitude, topo, rasterized=True, norm=divnorm,\r\n cmap=terrain_map, shading='auto')\r\n# Simple geographic plot, set aspect ratio beecause distance between lines of\r\n# longitude depends on latitude.\r\nax.set_aspect(1 / np.cos(np.deg2rad(49)))\r\nax.set_title('TwoSlopeNorm(x)')\r\ncb = fig.colorbar(pcm, shrink=0.6)\r\ncb.set_ticks([-500, 0, 1000, 2000, 3000, 4000])\r\nplt.show()\r\n```\r\n\r\n\r\n### Actual outcome\r\n\r\n**In 3.5.1** \r\n\r\n\r\n\r\n### Expected outcome\r\n\r\n\r\n**In 3.4.0** \r\n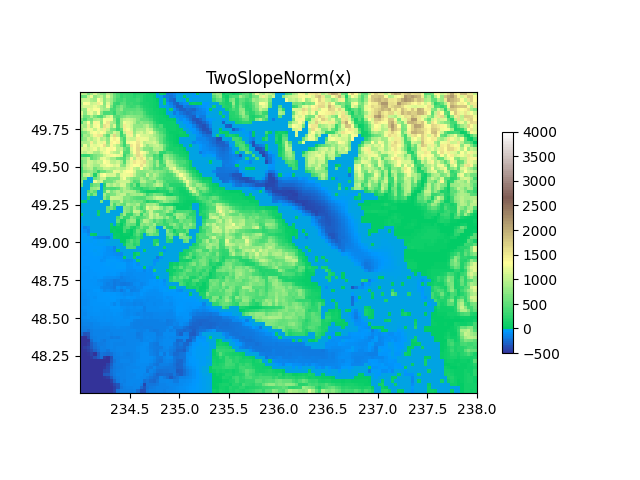\r\n\r\n\r\n### Additional information\r\n\r\n_No response_\r\n\r\n### Operating system\r\n\r\nAlpine (Windows Subsystem for Linux)\r\n\r\n### Matplotlib Version\r\n\r\n3.5.1\r\n\r\n### Matplotlib Backend\r\n\r\nagg\r\n\r\n### Python version\r\n\r\n3.8.10\r\n\r\n### Jupyter version\r\n\r\n3.2.5\r\n\r\n### Installation\r\n\r\npip","author":{"url":"https://github.com/MartenSkogh","@type":"Person","name":"MartenSkogh"},"datePublished":"2022-01-11T10:44:59.000Z","interactionStatistic":{"@type":"InteractionCounter","interactionType":"https://schema.org/CommentAction","userInteractionCount":15},"url":"https://github.com/22197/matplotlib/issues/22197"}| route-pattern | /_view_fragments/issues/show/:user_id/:repository/:id/issue_layout(.:format) |
| route-controller | voltron_issues_fragments |
| route-action | issue_layout |
| fetch-nonce | v2:967c75f9-2592-983d-66a9-ce8c9f280c28 |
| current-catalog-service-hash | 81bb79d38c15960b92d99bca9288a9108c7a47b18f2423d0f6438c5b7bcd2114 |
| request-id | B93A:B319:15F01C:1DE417:6A52E080 |
| html-safe-nonce | 5bc23dd7f4236d214142dd081bee07f9e034a4997133e585835928bd0f2ed879 |
| visitor-payload | eyJyZWZlcnJlciI6IiIsInJlcXVlc3RfaWQiOiJCOTNBOkIzMTk6MTVGMDFDOjFERTQxNzo2QTUyRTA4MCIsInZpc2l0b3JfaWQiOiI3ODY4MzY2NjE0NzQzNDA4NzY4IiwicmVnaW9uX2VkZ2UiOiJpYWQiLCJyZWdpb25fcmVuZGVyIjoiaWFkIn0= |
| visitor-hmac | e079dd1db13090eef7ed398c001f711b727f66cdb343a4283ede7b6f0a08c937 |
| hovercard-subject-tag | issue:1098981590 |
| github-keyboard-shortcuts | repository,issues,copilot |
| google-site-verification | Apib7-x98H0j5cPqHWwSMm6dNU4GmODRoqxLiDzdx9I |
| octolytics-url | https://collector.github.com/github/collect |
| analytics-location | / |
| fb:app_id | 1401488693436528 |
| apple-itunes-app | app-id=1477376905, app-argument=https://github.com/_view_fragments/issues/show/matplotlib/matplotlib/22197/issue_layout |
| twitter:image | https://opengraph.githubassets.com/ca92cc99827d2019358935643bd98768e045159e2d1888f4374d0683ea253035/matplotlib/matplotlib/issues/22197 |
| twitter:card | summary_large_image |
| og:image | https://opengraph.githubassets.com/ca92cc99827d2019358935643bd98768e045159e2d1888f4374d0683ea253035/matplotlib/matplotlib/issues/22197 |
| og:image:alt | Bug summary The behavior of TwoSlopeNorm has changed from Colormap Normalization 3.4.0 to Colormap Normalization 3.5.1. See the colorbar being centered and no longer a continuous linear scale. Code... |
| og:image:width | 1200 |
| og:image:height | 600 |
| og:site_name | GitHub |
| og:type | object |
| og:author:username | MartenSkogh |
| hostname | github.com |
| expected-hostname | github.com |
| None | b9a586c06a05a7a86fc7e3f4dbd03e42f6869085879aa184aa6369456dbd50fb |
| turbo-cache-control | no-preview |
| go-import | github.com/matplotlib/matplotlib git https://github.com/matplotlib/matplotlib.git |
| octolytics-dimension-user_id | 215947 |
| octolytics-dimension-user_login | matplotlib |
| octolytics-dimension-repository_id | 1385122 |
| octolytics-dimension-repository_nwo | matplotlib/matplotlib |
| octolytics-dimension-repository_public | true |
| octolytics-dimension-repository_is_fork | false |
| octolytics-dimension-repository_network_root_id | 1385122 |
| octolytics-dimension-repository_network_root_nwo | matplotlib/matplotlib |
| turbo-body-classes | logged-out env-production page-responsive |
| disable-turbo | false |
| browser-stats-url | https://api.github.com/_private/browser/stats |
| browser-errors-url | https://api.github.com/_private/browser/errors |
| release | 07a982c1d40157c619b364352b704c3ce66bb332 |
| ui-target | full |
| theme-color | #1e2327 |
| color-scheme | light dark |
Links:
Viewport: width=device-width

