Title: [Bug]: cm fontset in log scale does not use Unicode minus · Issue #21540 · matplotlib/matplotlib · GitHub
Open Graph Title: [Bug]: cm fontset in log scale does not use Unicode minus · Issue #21540 · matplotlib/matplotlib
X Title: [Bug]: cm fontset in log scale does not use Unicode minus · Issue #21540 · matplotlib/matplotlib
Description: Bug summary Minuses are shown as dashes when choosing the log scale, both in the exponent and in front of the actual number. Code for reproduction plot([-10, 10], [-10, 10]) yscale('symlog', linthresh=.1) Actual outcome Expected outcome ...
Open Graph Description: Bug summary Minuses are shown as dashes when choosing the log scale, both in the exponent and in front of the actual number. Code for reproduction plot([-10, 10], [-10, 10]) yscale('symlog', linthr...
X Description: Bug summary Minuses are shown as dashes when choosing the log scale, both in the exponent and in front of the actual number. Code for reproduction plot([-10, 10], [-10, 10]) yscale('symlog'...
Opengraph URL: https://github.com/matplotlib/matplotlib/issues/21540
X: @github
Domain: github.com
{"@context":"https://schema.org","@type":"DiscussionForumPosting","headline":"[Bug]: cm fontset in log scale does not use Unicode minus","articleBody":"### Bug summary\r\n\r\nMinuses are shown as dashes when choosing the log scale, both in the exponent and in front of the actual number.\r\n\r\n### Code for reproduction\r\n\r\n```python\r\nplot([-10, 10], [-10, 10])\r\nyscale('symlog', linthresh=.1)\r\n```\r\n\r\n\r\n### Actual outcome\r\n\r\n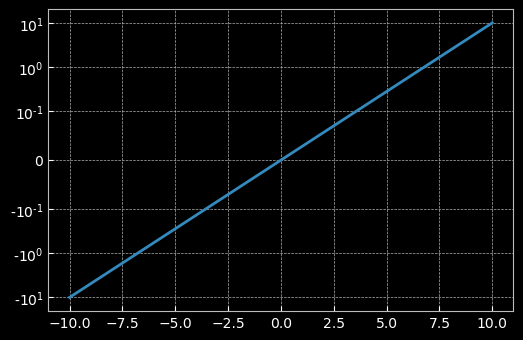\r\n\r\n\r\n### Expected outcome\r\n\r\nMinuses should be shown as minuses and not dashes.\r\n\r\n### Operating system\r\n\r\nOS/X\r\n\r\n### Matplotlib Version\r\n\r\n3.4.3\r\n\r\n### Matplotlib Backend\r\n\r\nmodule://matplotlib_inline.backend_inline\r\n\r\n### Python version\r\n\r\n3.8.1\r\n\r\n### Jupyter version\r\n\r\n3.2.1\r\n\r\n### Other libraries\r\n\r\n_No response_\r\n\r\n### Installation\r\n\r\nconda\r\n\r\n### Conda channel\r\n\r\n_No response_","author":{"url":"https://github.com/Atcold","@type":"Person","name":"Atcold"},"datePublished":"2021-11-04T16:15:22.000Z","interactionStatistic":{"@type":"InteractionCounter","interactionType":"https://schema.org/CommentAction","userInteractionCount":7},"url":"https://github.com/21540/matplotlib/issues/21540"}| route-pattern | /_view_fragments/issues/show/:user_id/:repository/:id/issue_layout(.:format) |
| route-controller | voltron_issues_fragments |
| route-action | issue_layout |
| fetch-nonce | v2:aa952b9a-0f97-1eae-75b0-bd4c0a2a37d0 |
| current-catalog-service-hash | 81bb79d38c15960b92d99bca9288a9108c7a47b18f2423d0f6438c5b7bcd2114 |
| request-id | A880:238281:4D1171:6705A4:6A52FF38 |
| html-safe-nonce | 6cad488a278733d4d4b497c6a678ce35b3e89f18c7227d7aa3875c5c590ebbb7 |
| visitor-payload | eyJyZWZlcnJlciI6IiIsInJlcXVlc3RfaWQiOiJBODgwOjIzODI4MTo0RDExNzE6NjcwNUE0OjZBNTJGRjM4IiwidmlzaXRvcl9pZCI6Ijc2ODc2NzI3OTY1MjUyOTc0NjQiLCJyZWdpb25fZWRnZSI6ImlhZCIsInJlZ2lvbl9yZW5kZXIiOiJpYWQifQ== |
| visitor-hmac | c0251c350f9d8fb27afc7eb9dcc4ca61a94a6b43ab1254557744fc606b40786b |
| hovercard-subject-tag | issue:1044940504 |
| github-keyboard-shortcuts | repository,issues,copilot |
| google-site-verification | Apib7-x98H0j5cPqHWwSMm6dNU4GmODRoqxLiDzdx9I |
| octolytics-url | https://collector.github.com/github/collect |
| analytics-location | / |
| fb:app_id | 1401488693436528 |
| apple-itunes-app | app-id=1477376905, app-argument=https://github.com/_view_fragments/issues/show/matplotlib/matplotlib/21540/issue_layout |
| twitter:image | https://opengraph.githubassets.com/28c7a233cd87de87411d77aaf64449ff7c789b7fb2eee9e3d275b21d800c734f/matplotlib/matplotlib/issues/21540 |
| twitter:card | summary_large_image |
| og:image | https://opengraph.githubassets.com/28c7a233cd87de87411d77aaf64449ff7c789b7fb2eee9e3d275b21d800c734f/matplotlib/matplotlib/issues/21540 |
| og:image:alt | Bug summary Minuses are shown as dashes when choosing the log scale, both in the exponent and in front of the actual number. Code for reproduction plot([-10, 10], [-10, 10]) yscale('symlog', linthr... |
| og:image:width | 1200 |
| og:image:height | 600 |
| og:site_name | GitHub |
| og:type | object |
| og:author:username | Atcold |
| hostname | github.com |
| expected-hostname | github.com |
| None | b9a586c06a05a7a86fc7e3f4dbd03e42f6869085879aa184aa6369456dbd50fb |
| turbo-cache-control | no-preview |
| go-import | github.com/matplotlib/matplotlib git https://github.com/matplotlib/matplotlib.git |
| octolytics-dimension-user_id | 215947 |
| octolytics-dimension-user_login | matplotlib |
| octolytics-dimension-repository_id | 1385122 |
| octolytics-dimension-repository_nwo | matplotlib/matplotlib |
| octolytics-dimension-repository_public | true |
| octolytics-dimension-repository_is_fork | false |
| octolytics-dimension-repository_network_root_id | 1385122 |
| octolytics-dimension-repository_network_root_nwo | matplotlib/matplotlib |
| turbo-body-classes | logged-out env-production page-responsive |
| disable-turbo | false |
| browser-stats-url | https://api.github.com/_private/browser/stats |
| browser-errors-url | https://api.github.com/_private/browser/errors |
| release | 07a982c1d40157c619b364352b704c3ce66bb332 |
| ui-target | full |
| theme-color | #1e2327 |
| color-scheme | light dark |
Links:
Viewport: width=device-width
