Title: [Bug]: regression with LineCollection + TwoSlopeNorm colorbar in matplotlib 3.5.0b1 · Issue #20993 · matplotlib/matplotlib · GitHub
Open Graph Title: [Bug]: regression with LineCollection + TwoSlopeNorm colorbar in matplotlib 3.5.0b1 · Issue #20993 · matplotlib/matplotlib
X Title: [Bug]: regression with LineCollection + TwoSlopeNorm colorbar in matplotlib 3.5.0b1 · Issue #20993 · matplotlib/matplotlib
Description: Bug summary Some image comparison tests in a project of mine are failing when running matplotlib 3.50b1 Code for reproduction import matplotlib.pyplot as plt from matplotlib.collections import LineCollection from matplotlib.colors import...
Open Graph Description: Bug summary Some image comparison tests in a project of mine are failing when running matplotlib 3.50b1 Code for reproduction import matplotlib.pyplot as plt from matplotlib.collections import Line...
X Description: Bug summary Some image comparison tests in a project of mine are failing when running matplotlib 3.50b1 Code for reproduction import matplotlib.pyplot as plt from matplotlib.collections import Line...
Opengraph URL: https://github.com/matplotlib/matplotlib/issues/20993
X: @github
Domain: github.com
{"@context":"https://schema.org","@type":"DiscussionForumPosting","headline":"[Bug]: regression with LineCollection + TwoSlopeNorm colorbar in matplotlib 3.5.0b1","articleBody":"### Bug summary\n\nSome image comparison tests in a project of mine are failing when running matplotlib 3.50b1\r\n\n\n### Code for reproduction\n\n```python\nimport matplotlib.pyplot as plt\r\nfrom matplotlib.collections import LineCollection\r\nfrom matplotlib.colors import TwoSlopeNorm\r\nimport numpy as np\r\n\r\nx = np.linspace(0, 10, 100)\r\ny = np.sin(x)\r\n# generate some data within some interval that doesn't have 0 its central value\r\nz = y + 0.5\r\n\r\npoints = np.array([x, y]).T.reshape(-1, 1, 2)\r\nsegments = np.concatenate([points[:-1], points[1:]], axis=1)\r\n\r\n# adapted from\r\n# https://matplotlib.org/stable/gallery/lines_bars_and_markers/multicolored_line.html\r\nlc = LineCollection(segments, norm=TwoSlopeNorm(0), cmap=\"RdYlBu\")\r\nlc.set_array(z)\r\n\r\nfig, ax = plt.subplots()\r\n\r\n# this line is just to compensate for the fact that the limits are not\r\n# automatically handled when the plot just contains a single LineCollection artist\r\nax.set(xlim=(0, 10), ylim=(-1, 1))\r\n\r\nline = ax.add_collection(lc)\r\nfig.colorbar(line)\n```\n\n\n### Actual outcome\n\n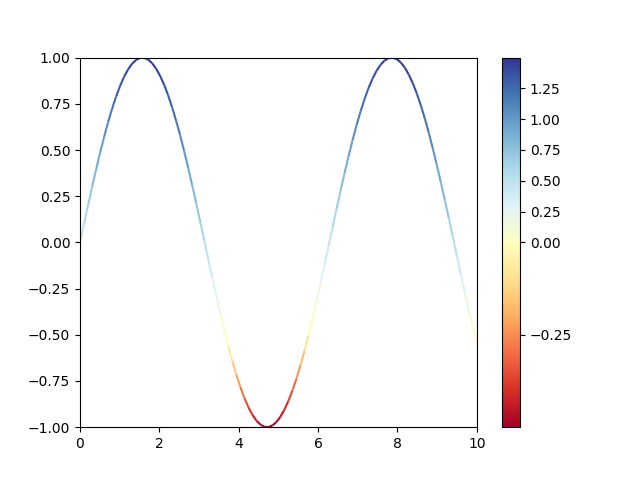\r\n\n\n### Expected outcome\n\nThis is the results with matplotlib 3.4.3\r\n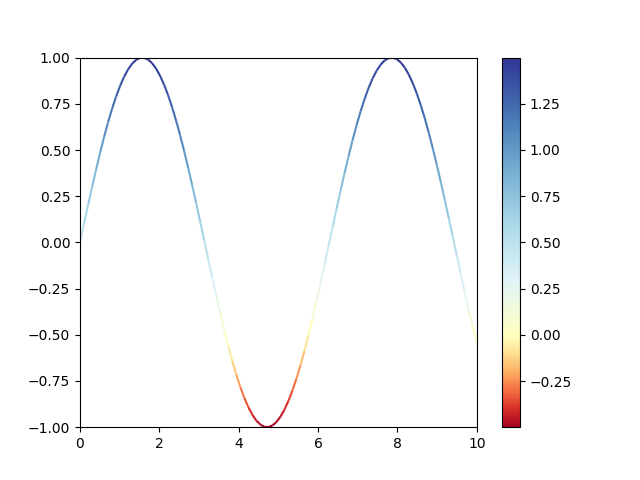\r\n\n\n### Operating system\n\nOS/X\n\n### Matplotlib Version\n\n3.5.0b1\n\n### Matplotlib Backend\n\nMacOSX\n\n### Python version\n\n3.9.6\n\n### Jupyter version\n\nN/A\n\n### Other libraries\n\n_No response_\n\n### Installation\n\npip\n\n### Conda channel\n\n_No response_","author":{"url":"https://github.com/neutrinoceros","@type":"Person","name":"neutrinoceros"},"datePublished":"2021-09-04T11:58:55.000Z","interactionStatistic":{"@type":"InteractionCounter","interactionType":"https://schema.org/CommentAction","userInteractionCount":18},"url":"https://github.com/20993/matplotlib/issues/20993"}| route-pattern | /_view_fragments/issues/show/:user_id/:repository/:id/issue_layout(.:format) |
| route-controller | voltron_issues_fragments |
| route-action | issue_layout |
| fetch-nonce | v2:3bbc2995-ab49-3fce-00fd-7ceedb8885fd |
| current-catalog-service-hash | 81bb79d38c15960b92d99bca9288a9108c7a47b18f2423d0f6438c5b7bcd2114 |
| request-id | C56E:10F926:38DB7:4BCD7:6A5231CB |
| html-safe-nonce | 6ecc3c98aa3700e0cc64dfb7be90becf150abf3f6db8478d5f84e7d2459ce5f3 |
| visitor-payload | eyJyZWZlcnJlciI6IiIsInJlcXVlc3RfaWQiOiJDNTZFOjEwRjkyNjozOERCNzo0QkNENzo2QTUyMzFDQiIsInZpc2l0b3JfaWQiOiIyNTU1Nzc3ODczODk1MTA5MDY4IiwicmVnaW9uX2VkZ2UiOiJpYWQiLCJyZWdpb25fcmVuZGVyIjoiaWFkIn0= |
| visitor-hmac | b348b16c4c63c0eae1e519fa0057cece6af126e7fad0370dde06d38c5b0b2ffa |
| hovercard-subject-tag | issue:988278369 |
| github-keyboard-shortcuts | repository,issues,copilot |
| google-site-verification | Apib7-x98H0j5cPqHWwSMm6dNU4GmODRoqxLiDzdx9I |
| octolytics-url | https://collector.github.com/github/collect |
| analytics-location | / |
| fb:app_id | 1401488693436528 |
| apple-itunes-app | app-id=1477376905, app-argument=https://github.com/_view_fragments/issues/show/matplotlib/matplotlib/20993/issue_layout |
| twitter:image | https://opengraph.githubassets.com/800015e27488bda347e449a30325a33398cd5edd0a24a2e5a0cdf73a14ed1676/matplotlib/matplotlib/issues/20993 |
| twitter:card | summary_large_image |
| og:image | https://opengraph.githubassets.com/800015e27488bda347e449a30325a33398cd5edd0a24a2e5a0cdf73a14ed1676/matplotlib/matplotlib/issues/20993 |
| og:image:alt | Bug summary Some image comparison tests in a project of mine are failing when running matplotlib 3.50b1 Code for reproduction import matplotlib.pyplot as plt from matplotlib.collections import Line... |
| og:image:width | 1200 |
| og:image:height | 600 |
| og:site_name | GitHub |
| og:type | object |
| og:author:username | neutrinoceros |
| hostname | github.com |
| expected-hostname | github.com |
| None | b9a586c06a05a7a86fc7e3f4dbd03e42f6869085879aa184aa6369456dbd50fb |
| turbo-cache-control | no-preview |
| go-import | github.com/matplotlib/matplotlib git https://github.com/matplotlib/matplotlib.git |
| octolytics-dimension-user_id | 215947 |
| octolytics-dimension-user_login | matplotlib |
| octolytics-dimension-repository_id | 1385122 |
| octolytics-dimension-repository_nwo | matplotlib/matplotlib |
| octolytics-dimension-repository_public | true |
| octolytics-dimension-repository_is_fork | false |
| octolytics-dimension-repository_network_root_id | 1385122 |
| octolytics-dimension-repository_network_root_nwo | matplotlib/matplotlib |
| turbo-body-classes | logged-out env-production page-responsive |
| disable-turbo | false |
| browser-stats-url | https://api.github.com/_private/browser/stats |
| browser-errors-url | https://api.github.com/_private/browser/errors |
| release | 7aed05249554b889eb33d002851a973eebcc7e91 |
| ui-target | full |
| theme-color | #1e2327 |
| color-scheme | light dark |
Links:
Viewport: width=device-width

