Title: Change in custom norm colour map display · Issue #20581 · matplotlib/matplotlib · GitHub
Open Graph Title: Change in custom norm colour map display · Issue #20581 · matplotlib/matplotlib
X Title: Change in custom norm colour map display · Issue #20581 · matplotlib/matplotlib
Description: Compare https://matplotlib.org/stable/tutorials/colors/colormapnorms.html vs https://matplotlib.org/devdocs/tutorials/colors/colormapnorms.html The same thing happens with the custom norm at the end of the tutorial. I'm not sure about Tw...
Open Graph Description: Compare https://matplotlib.org/stable/tutorials/colors/colormapnorms.html vs https://matplotlib.org/devdocs/tutorials/colors/colormapnorms.html The same thing happens with the custom norm at the en...
X Description: Compare https://matplotlib.org/stable/tutorials/colors/colormapnorms.html vs https://matplotlib.org/devdocs/tutorials/colors/colormapnorms.html The same thing happens with the custom norm at the en...
Opengraph URL: https://github.com/matplotlib/matplotlib/issues/20581
X: @github
Domain: github.com
{"@context":"https://schema.org","@type":"DiscussionForumPosting","headline":"Change in custom norm colour map display","articleBody":"Compare https://matplotlib.org/stable/tutorials/colors/colormapnorms.html\r\n\r\n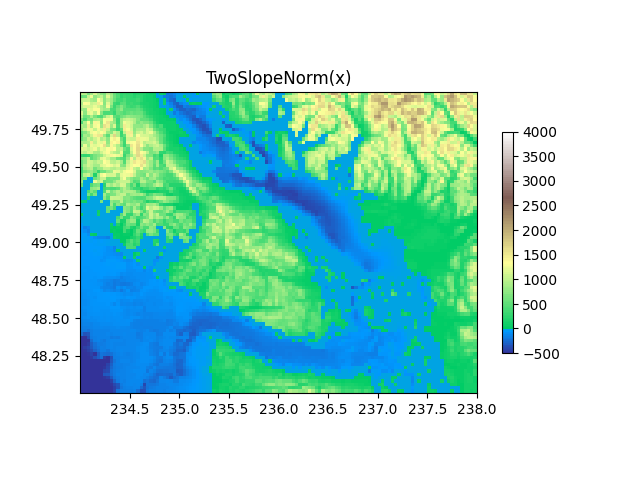\r\n\r\nvs https://matplotlib.org/devdocs/tutorials/colors/colormapnorms.html\r\n\r\n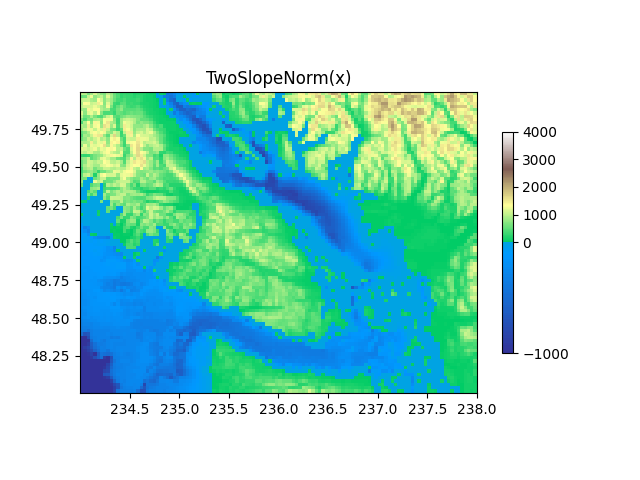\r\n\r\nThe same thing happens with the custom norm at the end of the tutorial. I'm not sure about `TwoSlopeNorm`, but at least for the custom one, the 0 is definitely not supposed to be in the middle. This _half_ broke when merging #20054, with the 0 tick at the old place but the 0 colour in the middle. Then with d1c5a6ab163f507e8b0f1b3871e0de8d72266098, the 0 tick also moved to the middle.","author":{"url":"https://github.com/QuLogic","@type":"Person","name":"QuLogic"},"datePublished":"2021-07-06T08:47:36.000Z","interactionStatistic":{"@type":"InteractionCounter","interactionType":"https://schema.org/CommentAction","userInteractionCount":3},"url":"https://github.com/20581/matplotlib/issues/20581"}| route-pattern | /_view_fragments/issues/show/:user_id/:repository/:id/issue_layout(.:format) |
| route-controller | voltron_issues_fragments |
| route-action | issue_layout |
| fetch-nonce | v2:915cb099-9eb4-3618-4bc9-1537d34e3f29 |
| current-catalog-service-hash | 81bb79d38c15960b92d99bca9288a9108c7a47b18f2423d0f6438c5b7bcd2114 |
| request-id | 83D4:15AA02:9639F8:CA2A23:6A5290A4 |
| html-safe-nonce | 2ec87f3351ff34978c6a1d8ab28ee8e5ecc5a21be50dd0ba461f6fa77ddd742e |
| visitor-payload | eyJyZWZlcnJlciI6IiIsInJlcXVlc3RfaWQiOiI4M0Q0OjE1QUEwMjo5NjM5Rjg6Q0EyQTIzOjZBNTI5MEE0IiwidmlzaXRvcl9pZCI6IjE5NTcyNjI2NTc4MDAyNzgxODAiLCJyZWdpb25fZWRnZSI6ImlhZCIsInJlZ2lvbl9yZW5kZXIiOiJpYWQifQ== |
| visitor-hmac | 0e444bef555efd9750b1d98fed05e1071d5444880a3689d56188c1c157d0e2b2 |
| hovercard-subject-tag | issue:937664345 |
| github-keyboard-shortcuts | repository,issues,copilot |
| google-site-verification | Apib7-x98H0j5cPqHWwSMm6dNU4GmODRoqxLiDzdx9I |
| octolytics-url | https://collector.github.com/github/collect |
| analytics-location | / |
| fb:app_id | 1401488693436528 |
| apple-itunes-app | app-id=1477376905, app-argument=https://github.com/_view_fragments/issues/show/matplotlib/matplotlib/20581/issue_layout |
| twitter:image | https://opengraph.githubassets.com/de22f0c09ebba7df48377f563ad24306a324319b014a527c57d06756c34b3638/matplotlib/matplotlib/issues/20581 |
| twitter:card | summary_large_image |
| og:image | https://opengraph.githubassets.com/de22f0c09ebba7df48377f563ad24306a324319b014a527c57d06756c34b3638/matplotlib/matplotlib/issues/20581 |
| og:image:alt | Compare https://matplotlib.org/stable/tutorials/colors/colormapnorms.html vs https://matplotlib.org/devdocs/tutorials/colors/colormapnorms.html The same thing happens with the custom norm at the en... |
| og:image:width | 1200 |
| og:image:height | 600 |
| og:site_name | GitHub |
| og:type | object |
| og:author:username | QuLogic |
| hostname | github.com |
| expected-hostname | github.com |
| None | b9a586c06a05a7a86fc7e3f4dbd03e42f6869085879aa184aa6369456dbd50fb |
| turbo-cache-control | no-preview |
| go-import | github.com/matplotlib/matplotlib git https://github.com/matplotlib/matplotlib.git |
| octolytics-dimension-user_id | 215947 |
| octolytics-dimension-user_login | matplotlib |
| octolytics-dimension-repository_id | 1385122 |
| octolytics-dimension-repository_nwo | matplotlib/matplotlib |
| octolytics-dimension-repository_public | true |
| octolytics-dimension-repository_is_fork | false |
| octolytics-dimension-repository_network_root_id | 1385122 |
| octolytics-dimension-repository_network_root_nwo | matplotlib/matplotlib |
| turbo-body-classes | logged-out env-production page-responsive |
| disable-turbo | false |
| browser-stats-url | https://api.github.com/_private/browser/stats |
| browser-errors-url | https://api.github.com/_private/browser/errors |
| release | 07a982c1d40157c619b364352b704c3ce66bb332 |
| ui-target | canary-2 |
| theme-color | #1e2327 |
| color-scheme | light dark |
Links:
Viewport: width=device-width

