Title: Radial grid missing in polar plots with ax.set_theta_direction(-1) and ax.set_theta_zero_location · Issue #20388 · matplotlib/matplotlib · GitHub
Open Graph Title: Radial grid missing in polar plots with ax.set_theta_direction(-1) and ax.set_theta_zero_location · Issue #20388 · matplotlib/matplotlib
X Title: Radial grid missing in polar plots with ax.set_theta_direction(-1) and ax.set_theta_zero_location · Issue #20388 · matplotlib/matplotlib
Description: When creating a polar plot with inverted theta direction and modifying the location of zero, the radial grid and outer boundary are missing for some locations of zero. import numpy as np import matplotlib.pyplot as plt r = np.arange(0, 2...
Open Graph Description: When creating a polar plot with inverted theta direction and modifying the location of zero, the radial grid and outer boundary are missing for some locations of zero. import numpy as np import mat...
X Description: When creating a polar plot with inverted theta direction and modifying the location of zero, the radial grid and outer boundary are missing for some locations of zero. import numpy as np import mat...
Opengraph URL: https://github.com/matplotlib/matplotlib/issues/20388
X: @github
Domain: github.com
{"@context":"https://schema.org","@type":"DiscussionForumPosting","headline":"Radial grid missing in polar plots with ax.set_theta_direction(-1) and ax.set_theta_zero_location","articleBody":"When creating a polar plot with inverted theta direction and modifying the location of zero, the radial grid and outer boundary are missing for some locations of zero.\r\n\r\n```python\r\nimport numpy as np\r\nimport matplotlib.pyplot as plt\r\n\r\nr = np.arange(0, 2, 0.01)\r\ntheta = 2 * np.pi * r\r\n\r\nfig, ax = plt.subplots(subplot_kw={'projection': 'polar'})\r\nax.plot(theta, r)\r\n\r\nax.set_theta_direction(-1)\r\n\r\nangle = 10 # 20 is not working, 10 is working\r\nax.set_theta_zero_location(\"N\",angle) \r\nplt.savefig('expected-outcome.png')\r\n\r\nangle = 20 # 20 is not working, 10 is working\r\nax.set_theta_zero_location(\"N\",angle) \r\nplt.savefig('actual-outcome.png')\r\n```\r\nThis is the outcome (can be reproduced with angle=20):\r\n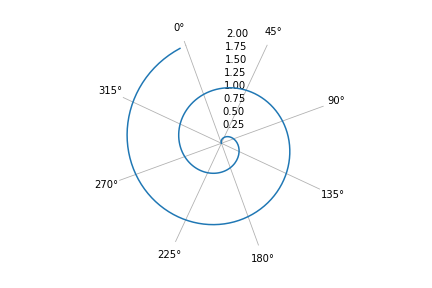\r\n\r\nAnd this is what it should look like (can be reproduced with angle=10):\r\n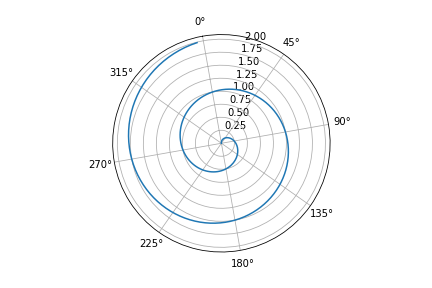\r\n\r\n```python\r\nimport matplotlib\r\nprint(matplotlib.__version__)\r\nimport platform\r\nprint(platform.python_version())\r\n3.4.2\r\n3.9.2\r\n```\r\n\r\nWhen I go back to matplotlib release v3.2.2 I don't have this issue.\r\n\r\n","author":{"url":"https://github.com/olehy","@type":"Person","name":"olehy"},"datePublished":"2021-06-08T11:45:28.000Z","interactionStatistic":{"@type":"InteractionCounter","interactionType":"https://schema.org/CommentAction","userInteractionCount":4},"url":"https://github.com/20388/matplotlib/issues/20388"}| route-pattern | /_view_fragments/issues/show/:user_id/:repository/:id/issue_layout(.:format) |
| route-controller | voltron_issues_fragments |
| route-action | issue_layout |
| fetch-nonce | v2:301e20b3-ded2-fad1-36d6-2d9f41e3313f |
| current-catalog-service-hash | 81bb79d38c15960b92d99bca9288a9108c7a47b18f2423d0f6438c5b7bcd2114 |
| request-id | C0F6:2D5E27:42F6F4:59B891:6A51C5A3 |
| html-safe-nonce | 44f13d8d223b61601f42f3a5c9316aa9a1572de7750a9bd52f2b544562c4ff52 |
| visitor-payload | eyJyZWZlcnJlciI6IiIsInJlcXVlc3RfaWQiOiJDMEY2OjJENUUyNzo0MkY2RjQ6NTlCODkxOjZBNTFDNUEzIiwidmlzaXRvcl9pZCI6Ijg0MjM5NTU5ODIwNjE3ODI0MzUiLCJyZWdpb25fZWRnZSI6ImlhZCIsInJlZ2lvbl9yZW5kZXIiOiJpYWQifQ== |
| visitor-hmac | 1a35fba2b2e16a62210ff543b66400dc3de2d9d7d53140bd1fce75aa607ac5fd |
| hovercard-subject-tag | issue:914898486 |
| github-keyboard-shortcuts | repository,issues,copilot |
| google-site-verification | Apib7-x98H0j5cPqHWwSMm6dNU4GmODRoqxLiDzdx9I |
| octolytics-url | https://collector.github.com/github/collect |
| analytics-location | / |
| fb:app_id | 1401488693436528 |
| apple-itunes-app | app-id=1477376905, app-argument=https://github.com/_view_fragments/issues/show/matplotlib/matplotlib/20388/issue_layout |
| twitter:image | https://opengraph.githubassets.com/eb1d4593df4379d136f7cb8af3ef2544e6a8a70f63eac527e925d58b09a8210d/matplotlib/matplotlib/issues/20388 |
| twitter:card | summary_large_image |
| og:image | https://opengraph.githubassets.com/eb1d4593df4379d136f7cb8af3ef2544e6a8a70f63eac527e925d58b09a8210d/matplotlib/matplotlib/issues/20388 |
| og:image:alt | When creating a polar plot with inverted theta direction and modifying the location of zero, the radial grid and outer boundary are missing for some locations of zero. import numpy as np import mat... |
| og:image:width | 1200 |
| og:image:height | 600 |
| og:site_name | GitHub |
| og:type | object |
| og:author:username | olehy |
| hostname | github.com |
| expected-hostname | github.com |
| None | b9a586c06a05a7a86fc7e3f4dbd03e42f6869085879aa184aa6369456dbd50fb |
| turbo-cache-control | no-preview |
| go-import | github.com/matplotlib/matplotlib git https://github.com/matplotlib/matplotlib.git |
| octolytics-dimension-user_id | 215947 |
| octolytics-dimension-user_login | matplotlib |
| octolytics-dimension-repository_id | 1385122 |
| octolytics-dimension-repository_nwo | matplotlib/matplotlib |
| octolytics-dimension-repository_public | true |
| octolytics-dimension-repository_is_fork | false |
| octolytics-dimension-repository_network_root_id | 1385122 |
| octolytics-dimension-repository_network_root_nwo | matplotlib/matplotlib |
| turbo-body-classes | logged-out env-production page-responsive |
| disable-turbo | false |
| browser-stats-url | https://api.github.com/_private/browser/stats |
| browser-errors-url | https://api.github.com/_private/browser/errors |
| release | 7aed05249554b889eb33d002851a973eebcc7e91 |
| ui-target | full |
| theme-color | #1e2327 |
| color-scheme | light dark |
Links:
Viewport: width=device-width

