Title: KeyError: 'gridOn' in axis.py when axis.tick_params() is used with reset = True · Issue #20149 · matplotlib/matplotlib · GitHub
Open Graph Title: KeyError: 'gridOn' in axis.py when axis.tick_params() is used with reset = True · Issue #20149 · matplotlib/matplotlib
X Title: KeyError: 'gridOn' in axis.py when axis.tick_params() is used with reset = True · Issue #20149 · matplotlib/matplotlib
Description: Bug report Bug summary Using matplotlib 3.4.1 on a fresh miniconda installation, trying to add a grid to an axis can return an error. It seems to be linked with the "reset" option of the tick_param function of an axis, if the function ha...
Open Graph Description: Bug report Bug summary Using matplotlib 3.4.1 on a fresh miniconda installation, trying to add a grid to an axis can return an error. It seems to be linked with the "reset" option of the tick_param...
X Description: Bug report Bug summary Using matplotlib 3.4.1 on a fresh miniconda installation, trying to add a grid to an axis can return an error. It seems to be linked with the "reset" option of the ...
Opengraph URL: https://github.com/matplotlib/matplotlib/issues/20149
X: @github
Domain: github.com
{"@context":"https://schema.org","@type":"DiscussionForumPosting","headline":"KeyError: 'gridOn' in axis.py when axis.tick_params() is used with reset = True","articleBody":"\u003c!--To help us understand and resolve your issue, please fill out the form to the best of your ability.--\u003e\r\n\u003c!--You can feel free to delete the sections that do not apply.--\u003e\r\n\r\n### Bug report\r\n\r\n**Bug summary**\r\n\r\nUsing matplotlib 3.4.1 on a fresh miniconda installation, trying to add a grid to an axis can return an error.\r\nIt seems to be linked with the \"reset\" option of the tick_param function of an axis, if the function has been used just before adding the grid. Activating the option seems to cause the issue; removing the option makes everything work.\r\n\r\n**Code for reproduction**\r\n\r\n```python\r\nfig, axes = plt.subplots(1, 4, sharey= True)\r\n\r\n# This doesn't work\r\nfor axis in axes:\r\n axis.tick_params(reset = True, axis='both', which='major', labelsize= 10, right = False, top = False)\r\nfor axis in axes:\r\n axis.grid(color = \"gainsboro\", linestyle='-', linewidth=0.5) \r\n axis.set_facecolor('#FCFCFC')\r\n\r\n# This works\r\nfor axis in axes:\r\n axis.tick_params(reset = False, axis='both', which='major', labelsize= 10, right = False, top = False)\r\nfor axis in axes:\r\n axis.grid(color = \"gainsboro\", linestyle='-', linewidth=0.5) \r\n axis.set_facecolor('#FCFCFC')\r\n```\r\n\r\n**Actual outcome**\r\n\r\n\u003c!--The output produced by the above code, which may be a screenshot, console output, etc.--\u003e\r\n\r\n```python\r\n File \"C:\\ProgramData\\Miniconda3\\lib\\site-packages\\matplotlib\\axis.py\", line 1414, in grid\r\n gridkw['gridOn'] = not self._major_tick_kw['gridOn']\r\n\r\nKeyError: 'gridOn'\r\n```\r\n\r\n**Expected outcome**\r\n\r\n\u003c!--A description of the expected outcome from the code snippet--\u003e\r\n\u003c!--If this used to work in an earlier version of Matplotlib, please note the version it used to work on--\u003e\r\n\r\nThe grid is expected to be added to the figure without any issue, resulting in the following appearance : \r\n\r\n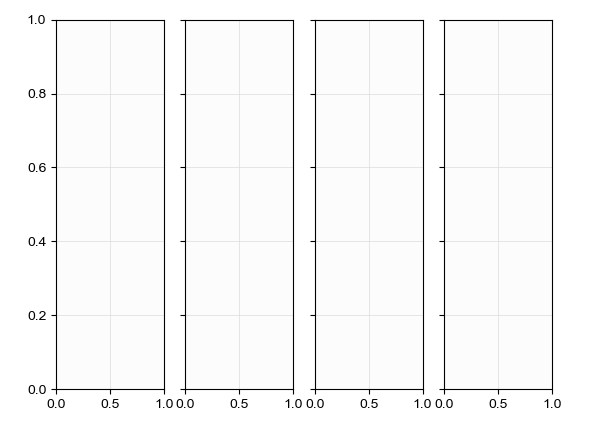\r\n\r\n**Matplotlib version**\r\n\u003c!--Please specify your platform and versions of the relevant libraries you are using:--\u003e\r\n * Operating system: Windows 10\r\n * Matplotlib version (`import matplotlib; print(matplotlib.__version__)`): 3.4.1\r\n * Matplotlib backend (`print(matplotlib.get_backend())`): Qt5Agg\r\n * Python version: 3.9.1\r\n\r\n\u003c!--Please tell us how you installed matplotlib and python e.g., from source, pip, conda--\u003e\r\n\u003c!--If you installed from conda, please specify which channel you used if not the default--\u003e\r\n\r\nMatplotlib was installed via the anaconda command prompt, using `conda install -c conda-forge matplotlib`.\r\n\r\n","author":{"url":"https://github.com/Klemet","@type":"Person","name":"Klemet"},"datePublished":"2021-05-04T01:14:01.000Z","interactionStatistic":{"@type":"InteractionCounter","interactionType":"https://schema.org/CommentAction","userInteractionCount":0},"url":"https://github.com/20149/matplotlib/issues/20149"}| route-pattern | /_view_fragments/issues/show/:user_id/:repository/:id/issue_layout(.:format) |
| route-controller | voltron_issues_fragments |
| route-action | issue_layout |
| fetch-nonce | v2:0581793c-173c-60b8-d7fb-09c92b3171f0 |
| current-catalog-service-hash | 81bb79d38c15960b92d99bca9288a9108c7a47b18f2423d0f6438c5b7bcd2114 |
| request-id | 8D86:24B913:2AF34:3A58E:6A525EBD |
| html-safe-nonce | e86317d5157fb5afc3b5663dedb29bd81e33f7a8856dfdf99b074f6817d52b29 |
| visitor-payload | eyJyZWZlcnJlciI6IiIsInJlcXVlc3RfaWQiOiI4RDg2OjI0QjkxMzoyQUYzNDozQTU4RTo2QTUyNUVCRCIsInZpc2l0b3JfaWQiOiI3NjAyOTczNTY3NTQ2OTczODg1IiwicmVnaW9uX2VkZ2UiOiJpYWQiLCJyZWdpb25fcmVuZGVyIjoiaWFkIn0= |
| visitor-hmac | d84c5fe60504680bd24948a1755ce35a625c58607f4a0dfa962ac60c3c7d118e |
| hovercard-subject-tag | issue:875024013 |
| github-keyboard-shortcuts | repository,issues,copilot |
| google-site-verification | Apib7-x98H0j5cPqHWwSMm6dNU4GmODRoqxLiDzdx9I |
| octolytics-url | https://collector.github.com/github/collect |
| analytics-location | / |
| fb:app_id | 1401488693436528 |
| apple-itunes-app | app-id=1477376905, app-argument=https://github.com/_view_fragments/issues/show/matplotlib/matplotlib/20149/issue_layout |
| twitter:image | https://opengraph.githubassets.com/4c5d5152a8e5ae8accb3e3324dd28b034b0c5e600a9e4881692840ac8f5c2b6b/matplotlib/matplotlib/issues/20149 |
| twitter:card | summary_large_image |
| og:image | https://opengraph.githubassets.com/4c5d5152a8e5ae8accb3e3324dd28b034b0c5e600a9e4881692840ac8f5c2b6b/matplotlib/matplotlib/issues/20149 |
| og:image:alt | Bug report Bug summary Using matplotlib 3.4.1 on a fresh miniconda installation, trying to add a grid to an axis can return an error. It seems to be linked with the "reset" option of the tick_param... |
| og:image:width | 1200 |
| og:image:height | 600 |
| og:site_name | GitHub |
| og:type | object |
| og:author:username | Klemet |
| hostname | github.com |
| expected-hostname | github.com |
| None | b9a586c06a05a7a86fc7e3f4dbd03e42f6869085879aa184aa6369456dbd50fb |
| turbo-cache-control | no-preview |
| go-import | github.com/matplotlib/matplotlib git https://github.com/matplotlib/matplotlib.git |
| octolytics-dimension-user_id | 215947 |
| octolytics-dimension-user_login | matplotlib |
| octolytics-dimension-repository_id | 1385122 |
| octolytics-dimension-repository_nwo | matplotlib/matplotlib |
| octolytics-dimension-repository_public | true |
| octolytics-dimension-repository_is_fork | false |
| octolytics-dimension-repository_network_root_id | 1385122 |
| octolytics-dimension-repository_network_root_nwo | matplotlib/matplotlib |
| turbo-body-classes | logged-out env-production page-responsive |
| disable-turbo | false |
| browser-stats-url | https://api.github.com/_private/browser/stats |
| browser-errors-url | https://api.github.com/_private/browser/errors |
| release | 7aed05249554b889eb33d002851a973eebcc7e91 |
| ui-target | full |
| theme-color | #1e2327 |
| color-scheme | light dark |
Links:
Viewport: width=device-width
