Title: Notebook plotting regression in 3.4.0rc* · Issue #19701 · matplotlib/matplotlib · GitHub
Open Graph Title: Notebook plotting regression in 3.4.0rc* · Issue #19701 · matplotlib/matplotlib
X Title: Notebook plotting regression in 3.4.0rc* · Issue #19701 · matplotlib/matplotlib
Description: Bug report Bug summary Blitting support have been added in the notebook backend, however, it is fully working, see #19633 and in particular #19633 (comment). This breaks plotting for libraries using the supports_blit property of the canv...
Open Graph Description: Bug report Bug summary Blitting support have been added in the notebook backend, however, it is fully working, see #19633 and in particular #19633 (comment). This breaks plotting for libraries usin...
X Description: Bug report Bug summary Blitting support have been added in the notebook backend, however, it is fully working, see #19633 and in particular #19633 (comment). This breaks plotting for libraries usin...
Opengraph URL: https://github.com/matplotlib/matplotlib/issues/19701
X: @github
Domain: github.com
{"@context":"https://schema.org","@type":"DiscussionForumPosting","headline":"Notebook plotting regression in 3.4.0rc*","articleBody":"\u003c!--To help us understand and resolve your issue, please fill out the form to the best of your ability.--\u003e\r\n\u003c!--You can feel free to delete the sections that do not apply.--\u003e\r\n\r\n### Bug report\r\n\r\n**Bug summary**\r\n\r\n\u003c!--A short 1-2 sentences that succinctly describes the bug--\u003e\r\n\r\nBlitting support have been added in the notebook backend, however, it is fully working, see https://github.com/matplotlib/matplotlib/issues/19633 and in particular https://github.com/matplotlib/matplotlib/issues/19633#issuecomment-795966581.\r\n\r\nThis breaks plotting for libraries using the `supports_blit` property of the canvas to know if [blitting should be used](https://github.com/hyperspy/hyperspy/blob/5cd76133ae408d50e573d4bf6cf903b03fd8efb1/hyperspy/drawing/figure.py#L59). \r\n\r\nEven if I am really looking forward using blitting in the notebook/ipympl backend, in 3.4.0rc, it seems that this is not ready to be fully used and it breaks plotting in the notebook of hyperspy.\r\nWould it be make sense to have `supports_blit` returns `False` for the notebook backend until blitting is working fine?\r\n\r\n**Code for reproduction**\r\n\r\n\u003c!--A minimum code snippet required to reproduce the bug.\r\nPlease make sure to minimize the number of dependencies required, and provide\r\nany necessary plotted data.\r\nAvoid using threads, as Matplotlib is (explicitly) not thread-safe.--\u003e\r\n\r\nIt is difficult to provide a minimum example because of https://github.com/matplotlib/matplotlib/issues/19633#issuecomment-795966581 but it can be reproduce using hyperspy:\r\n\r\n```python\r\n# Paste your code here\r\n%matplotlib notebook\r\nimport hyperspy.api as hs\r\n\r\ns = hs.datasets.artificial_data.get_core_loss_eels_line_scan_signal()\r\ns.plot()\r\n```\r\n**Actual outcome**\r\n\r\n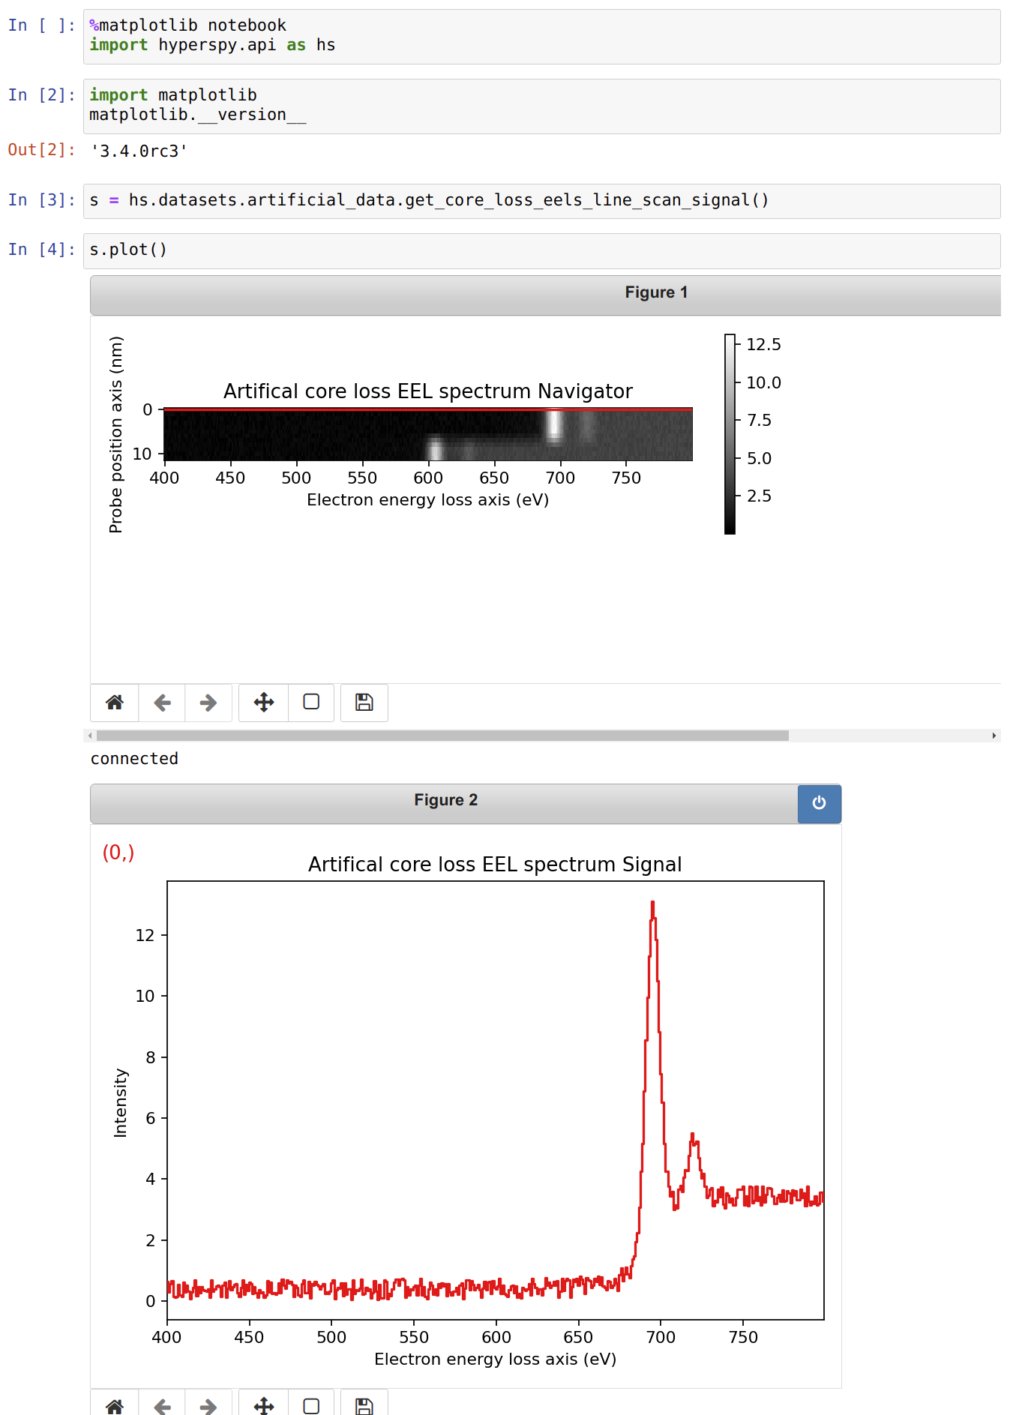\r\n\r\nSimilarly ss reported in by @ianhi in #19633, this will use 100% of a CPU. Also, the width of the figure is not correct and the axes disappear when changing the size of the figure:\r\n\r\n\r\n**Expected outcome**\r\n\r\nUsing blitting should work as with other backend, until then, blitting should not be defined as supported for the notebook/ipympl backend.\r\n\r\n\u003c!--A description of the expected outcome from the code snippet--\u003e\r\n\u003c!--If this used to work in an earlier version of Matplotlib, please note the version it used to work on--\u003e\r\n\r\n**Matplotlib version**\r\n\u003c!--Please specify your platform and versions of the relevant libraries you are using:--\u003e\r\n * Operating system: \r\n * Matplotlib version (`import matplotlib; print(matplotlib.__version__)`): \r\n * Matplotlib backend (`print(matplotlib.get_backend())`): \r\n * Python version: \r\n * Jupyter version (if applicable): \r\n * Other libraries: \r\n\r\n\u003c!--Please tell us how you installed matplotlib and python e.g., from source, pip, conda--\u003e\r\n\u003c!--If you installed from conda, please specify which channel you used if not the default--\u003e\r\n\r\n","author":{"url":"https://github.com/ericpre","@type":"Person","name":"ericpre"},"datePublished":"2021-03-14T13:14:10.000Z","interactionStatistic":{"@type":"InteractionCounter","interactionType":"https://schema.org/CommentAction","userInteractionCount":2},"url":"https://github.com/19701/matplotlib/issues/19701"}| route-pattern | /_view_fragments/issues/show/:user_id/:repository/:id/issue_layout(.:format) |
| route-controller | voltron_issues_fragments |
| route-action | issue_layout |
| fetch-nonce | v2:c590e6e3-3517-c81f-0d24-578715f3b879 |
| current-catalog-service-hash | 81bb79d38c15960b92d99bca9288a9108c7a47b18f2423d0f6438c5b7bcd2114 |
| request-id | DE5E:1AF501:14DE21E:1B85125:6A51B996 |
| html-safe-nonce | 8043d2f2d7b8fe3da5801a0202d302f3dc407b820c7542ab8f0827fbdedb5573 |
| visitor-payload | eyJyZWZlcnJlciI6IiIsInJlcXVlc3RfaWQiOiJERTVFOjFBRjUwMToxNERFMjFFOjFCODUxMjU6NkE1MUI5OTYiLCJ2aXNpdG9yX2lkIjoiMzI4NDI5MzEyNTc0NTUyMzA5NCIsInJlZ2lvbl9lZGdlIjoiaWFkIiwicmVnaW9uX3JlbmRlciI6ImlhZCJ9 |
| visitor-hmac | 14c808f637290dfcd2e8899d95a183d460fff1084238737570aac06947287d06 |
| hovercard-subject-tag | issue:831153582 |
| github-keyboard-shortcuts | repository,issues,copilot |
| google-site-verification | Apib7-x98H0j5cPqHWwSMm6dNU4GmODRoqxLiDzdx9I |
| octolytics-url | https://collector.github.com/github/collect |
| analytics-location | / |
| fb:app_id | 1401488693436528 |
| apple-itunes-app | app-id=1477376905, app-argument=https://github.com/_view_fragments/issues/show/matplotlib/matplotlib/19701/issue_layout |
| twitter:image | https://opengraph.githubassets.com/11974722b1e920e4700c7012b58cee8684b50900ea9dc67d201606fc9a52dddd/matplotlib/matplotlib/issues/19701 |
| twitter:card | summary_large_image |
| og:image | https://opengraph.githubassets.com/11974722b1e920e4700c7012b58cee8684b50900ea9dc67d201606fc9a52dddd/matplotlib/matplotlib/issues/19701 |
| og:image:alt | Bug report Bug summary Blitting support have been added in the notebook backend, however, it is fully working, see #19633 and in particular #19633 (comment). This breaks plotting for libraries usin... |
| og:image:width | 1200 |
| og:image:height | 600 |
| og:site_name | GitHub |
| og:type | object |
| og:author:username | ericpre |
| hostname | github.com |
| expected-hostname | github.com |
| None | b9a586c06a05a7a86fc7e3f4dbd03e42f6869085879aa184aa6369456dbd50fb |
| turbo-cache-control | no-preview |
| go-import | github.com/matplotlib/matplotlib git https://github.com/matplotlib/matplotlib.git |
| octolytics-dimension-user_id | 215947 |
| octolytics-dimension-user_login | matplotlib |
| octolytics-dimension-repository_id | 1385122 |
| octolytics-dimension-repository_nwo | matplotlib/matplotlib |
| octolytics-dimension-repository_public | true |
| octolytics-dimension-repository_is_fork | false |
| octolytics-dimension-repository_network_root_id | 1385122 |
| octolytics-dimension-repository_network_root_nwo | matplotlib/matplotlib |
| turbo-body-classes | logged-out env-production page-responsive |
| disable-turbo | false |
| browser-stats-url | https://api.github.com/_private/browser/stats |
| browser-errors-url | https://api.github.com/_private/browser/errors |
| release | 7aed05249554b889eb33d002851a973eebcc7e91 |
| ui-target | full |
| theme-color | #1e2327 |
| color-scheme | light dark |
Links:
Viewport: width=device-width

