Title: plot_surface should shade at draw time after projection to axes space, instead of doing so in data space · Issue #18120 · matplotlib/matplotlib · GitHub
Open Graph Title: plot_surface should shade at draw time after projection to axes space, instead of doing so in data space · Issue #18120 · matplotlib/matplotlib
X Title: plot_surface should shade at draw time after projection to axes space, instead of doing so in data space · Issue #18120 · matplotlib/matplotlib
Description: Bug report Bug summary import matplotlib.pyplot as plt import numpy as np fig = plt.figure() x, y = np.mgrid[-10:11, -10:11] z = -(x ** 2 + y ** 2) ax = fig.add_subplot(121, projection="3d") pc = ax.plot_surface(x, y, z) ax = fig.add_sub...
Open Graph Description: Bug report Bug summary import matplotlib.pyplot as plt import numpy as np fig = plt.figure() x, y = np.mgrid[-10:11, -10:11] z = -(x ** 2 + y ** 2) ax = fig.add_subplot(121, projection="3d") pc = a...
X Description: Bug report Bug summary import matplotlib.pyplot as plt import numpy as np fig = plt.figure() x, y = np.mgrid[-10:11, -10:11] z = -(x ** 2 + y ** 2) ax = fig.add_subplot(121, projection="3d&quo...
Opengraph URL: https://github.com/matplotlib/matplotlib/issues/18120
X: @github
Domain: github.com
{"@context":"https://schema.org","@type":"DiscussionForumPosting","headline":"plot_surface should shade at draw time after projection to axes space, instead of doing so in data space","articleBody":"\u003c!--To help us understand and resolve your issue, please fill out the form to the best of your ability.--\u003e\r\n\u003c!--You can feel free to delete the sections that do not apply.--\u003e\r\n\r\n### Bug report\r\n\r\n**Bug summary**\r\n\r\n```python\r\nimport matplotlib.pyplot as plt\r\nimport numpy as np\r\n\r\nfig = plt.figure()\r\nx, y = np.mgrid[-10:11, -10:11]\r\nz = -(x ** 2 + y ** 2)\r\n\r\nax = fig.add_subplot(121, projection=\"3d\")\r\npc = ax.plot_surface(x, y, z)\r\nax = fig.add_subplot(122, projection=\"3d\")\r\npc = ax.plot_surface(x, y, z / 10)\r\n\r\nplt.show()\r\n```\r\ngives\r\n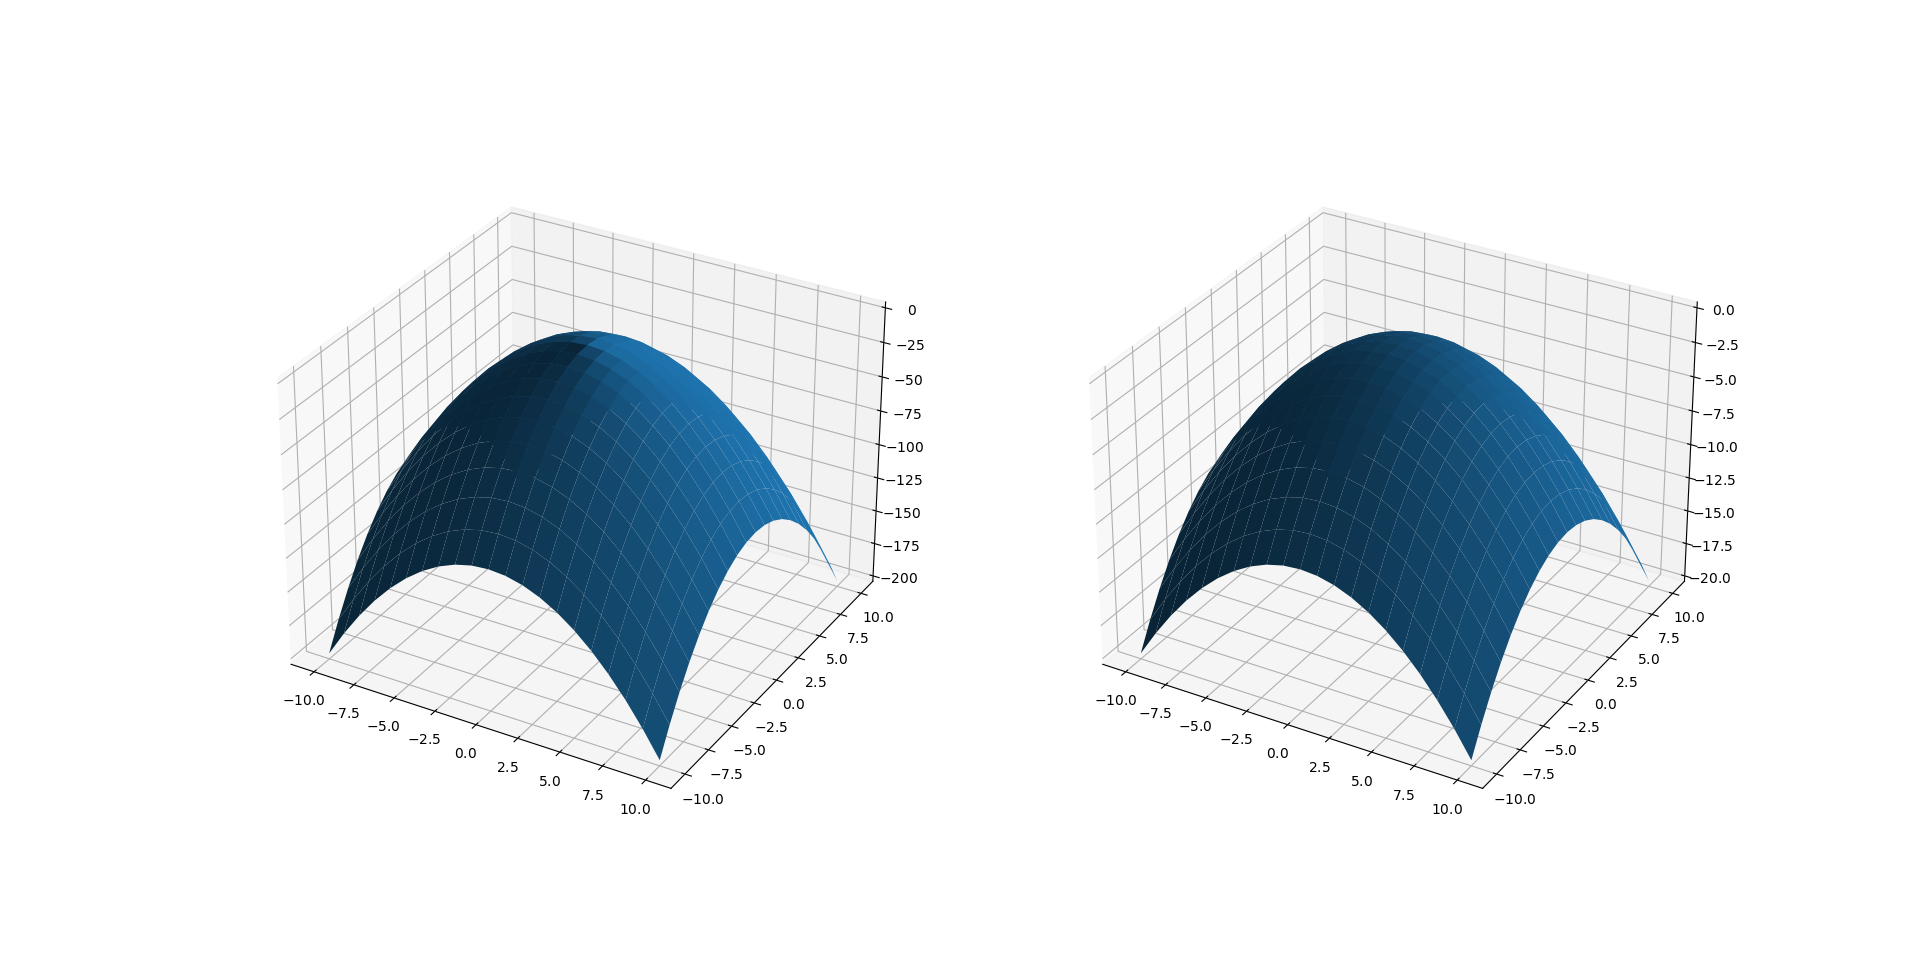\r\n\r\nIn the right plot, the shading is basically constant throughout the image; in the left one, it changes very sharply at the tip of the paraboloid -- in fact, it nearly looks like the patches immediately at the left and the right are close to being the darkest and the brightest ones! Given that these two patches have nearly the same orientation, how is that possible?\r\n\r\nFrom a quick investigation, I believe the root of the issue is the following: the shading is computed as the dot product of the patch normal(\\*) and the illumination direction, but this dot product is taken *in data space* (immediately when the Poly3DCollection is built in plot_surface) rather than after projection to \"3d screen space\" (at draw time). In data space, the angle between the patches at the tip of the paraboloid is indeed much larger (the z-scale is much wider than the x/y-scale), hence the large change in dot product.\r\n\r\n(\\*) The patch normal is approximated using just three of the vertices of each patch, but this is not the source of the issue -- using e.g. the average of the normals computed at each vertex of the patch doesn't help.\r\n\r\nTherefore, I believe the shading should instead be computed at draw time, after projection to \"3d screen space\". As another argument in favor of such behavior, consider also that if we ever manage to support log-scale in mplot3d, we'd certainly have to compute the dot products after scale application (because they are even more meaningless before scale application). As usual, this could possibly be opt-in via a flag... or perhaps not.\r\n\r\n**Matplotlib version**\r\n\u003c!--Please specify your platform and versions of the relevant libraries you are using:--\u003e\r\n * Operating system: linux\r\n * Matplotlib version: master\r\n * Matplotlib backend (`print(matplotlib.get_backend())`): qt5agg\r\n * Python version: 38\r\n * Jupyter version (if applicable):\r\n * Other libraries: \r\n\r\n\u003c!--Please tell us how you installed matplotlib and python e.g., from source, pip, conda--\u003e\r\n\u003c!--If you installed from conda, please specify which channel you used if not the default--\u003e\r\n\r\n","author":{"url":"https://github.com/anntzer","@type":"Person","name":"anntzer"},"datePublished":"2020-07-29T18:17:23.000Z","interactionStatistic":{"@type":"InteractionCounter","interactionType":"https://schema.org/CommentAction","userInteractionCount":5},"url":"https://github.com/18120/matplotlib/issues/18120"}| route-pattern | /_view_fragments/issues/show/:user_id/:repository/:id/issue_layout(.:format) |
| route-controller | voltron_issues_fragments |
| route-action | issue_layout |
| fetch-nonce | v2:528e500e-af75-947c-0f17-3b070803ac1f |
| current-catalog-service-hash | 81bb79d38c15960b92d99bca9288a9108c7a47b18f2423d0f6438c5b7bcd2114 |
| request-id | 943E:C1E1E:1D08CC:273CC2:6A5255E3 |
| html-safe-nonce | e787329b3d27810e833d80d2625d7ce836665de0dbb2d95861667a0320ebf9c4 |
| visitor-payload | eyJyZWZlcnJlciI6IiIsInJlcXVlc3RfaWQiOiI5NDNFOkMxRTFFOjFEMDhDQzoyNzNDQzI6NkE1MjU1RTMiLCJ2aXNpdG9yX2lkIjoiNjYzOTAwNzUyMDIwOTE5Nzc5IiwicmVnaW9uX2VkZ2UiOiJpYWQiLCJyZWdpb25fcmVuZGVyIjoiaWFkIn0= |
| visitor-hmac | 7123ab63f7fcf690ad7db2e4a12bbab53d3465b0b65420f6021d62fedab633cf |
| hovercard-subject-tag | issue:668043151 |
| github-keyboard-shortcuts | repository,issues,copilot |
| google-site-verification | Apib7-x98H0j5cPqHWwSMm6dNU4GmODRoqxLiDzdx9I |
| octolytics-url | https://collector.github.com/github/collect |
| analytics-location | / |
| fb:app_id | 1401488693436528 |
| apple-itunes-app | app-id=1477376905, app-argument=https://github.com/_view_fragments/issues/show/matplotlib/matplotlib/18120/issue_layout |
| twitter:image | https://opengraph.githubassets.com/e50f38342baaeb20c67407862ada3389c32201a6bdddff488556a4e19454f927/matplotlib/matplotlib/issues/18120 |
| twitter:card | summary_large_image |
| og:image | https://opengraph.githubassets.com/e50f38342baaeb20c67407862ada3389c32201a6bdddff488556a4e19454f927/matplotlib/matplotlib/issues/18120 |
| og:image:alt | Bug report Bug summary import matplotlib.pyplot as plt import numpy as np fig = plt.figure() x, y = np.mgrid[-10:11, -10:11] z = -(x ** 2 + y ** 2) ax = fig.add_subplot(121, projection="3d") pc = a... |
| og:image:width | 1200 |
| og:image:height | 600 |
| og:site_name | GitHub |
| og:type | object |
| og:author:username | anntzer |
| hostname | github.com |
| expected-hostname | github.com |
| None | b9a586c06a05a7a86fc7e3f4dbd03e42f6869085879aa184aa6369456dbd50fb |
| turbo-cache-control | no-preview |
| go-import | github.com/matplotlib/matplotlib git https://github.com/matplotlib/matplotlib.git |
| octolytics-dimension-user_id | 215947 |
| octolytics-dimension-user_login | matplotlib |
| octolytics-dimension-repository_id | 1385122 |
| octolytics-dimension-repository_nwo | matplotlib/matplotlib |
| octolytics-dimension-repository_public | true |
| octolytics-dimension-repository_is_fork | false |
| octolytics-dimension-repository_network_root_id | 1385122 |
| octolytics-dimension-repository_network_root_nwo | matplotlib/matplotlib |
| turbo-body-classes | logged-out env-production page-responsive |
| disable-turbo | false |
| browser-stats-url | https://api.github.com/_private/browser/stats |
| browser-errors-url | https://api.github.com/_private/browser/errors |
| release | 7aed05249554b889eb33d002851a973eebcc7e91 |
| ui-target | full |
| theme-color | #1e2327 |
| color-scheme | light dark |
Links:
Viewport: width=device-width
