Title: Proposal: add_subfigs.... · Issue #17375 · matplotlib/matplotlib · GitHub
Open Graph Title: Proposal: add_subfigs.... · Issue #17375 · matplotlib/matplotlib
X Title: Proposal: add_subfigs.... · Issue #17375 · matplotlib/matplotlib
Description: In #14421 there was some concern that gridspec was being overloaded and that something else should be doing that layout. I've mocked the following up, and it works quite well so far. Getting past mockup will be a fair bit of work, so wan...
Open Graph Description: In #14421 there was some concern that gridspec was being overloaded and that something else should be doing that layout. I've mocked the following up, and it works quite well so far. Getting past m...
X Description: In #14421 there was some concern that gridspec was being overloaded and that something else should be doing that layout. I've mocked the following up, and it works quite well so far. Getting pa...
Opengraph URL: https://github.com/matplotlib/matplotlib/issues/17375
X: @github
Domain: github.com
{"@context":"https://schema.org","@type":"DiscussionForumPosting","headline":"Proposal: add_subfigs....","articleBody":"In #14421 there was some concern that `gridspec` was being overloaded and that something else should be doing that layout. \r\n\r\nI've mocked the following up, and it works quite well so far. Getting past mockup will be a fair bit of work, so wanted some comment.\r\n\r\nFor sub-grids, currently we would do:\r\n\r\n```python\r\nfig = plt.figure()\r\ngs = fig.add_gridspec(2, 1)\r\n\r\naxs0 = gs[0, 0].subgridspec(3, 2).subplots()\r\naxs1 = gs[1, 0].subgridspec(3, 2).subplots()\r\n```\r\n\r\n\r\n\r\nWhich is fine, for what it is. But imagine you want to have a colorbar that only pertains to `gs[0, 0]` or a legend just for that gridspec, or a suptitle. Currently we would have to add all that to `gridspec`. But as @timhoffm pointed out, gridspec is not *really* equipped for this sort of thing. \r\n\r\nHere instead I propose we create a new base class for `Figure`, say `FigureBase` and make `Figure` a subclass of that, and `SubFigure` a subclass of that. \r\n\r\n`FigureBase` contains all the layout-specific functions of `Figure` and all the figure-level artists (figure legends, figure colorbars, suptitle, future supx/ylabel, etc). `FigureBase` then gets a new method `subfigures` and `add_subfigure`, which give a virtual figure within the current figure. \r\n\r\nNow, instead of the above, we write:\r\n\r\n```python \r\nfig = plt.figure()\r\nsfigs = fig.subfigures(2, 1)\r\naxs0 = sfigs[0, 0].subplots(3, 2)\r\naxs1 = sfigs[1, 0].subplots(2, 2)\r\n```\r\n\r\n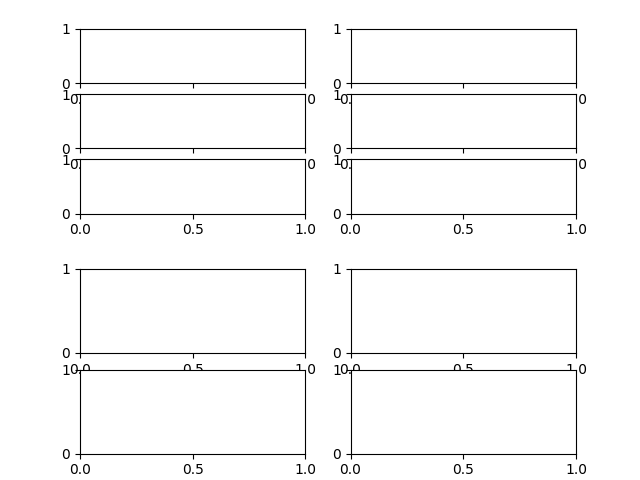\r\n\r\nYou can also do `add_subfigure` using subplotspecs\r\n\r\n```python\r\nfig = plt.figure()\r\ngs = fig.add_gridspec(2, 2)\r\nsfig = fig.add_subfigure(gs[:, 1])\r\naxs0 = sfig.subplots(3, 2)\r\n\r\nax1 = fig.add_subplot(gs[0, 0])\r\nax2 = fig.add_subplot(gs[1, 0])\r\nplt.show()\r\n```\r\n\r\n\r\n\r\nThe subfigs should be API-wise the same as a normal figure. And a subfig can then create subfigs. The subfigs keep track of their parent fig, and the parent keeps track of its subfigs, so traversing the tree is straight forward. \r\n\r\nI think this is cleaner than overloading gridspec. Its semi-major surgery on Figure, but I've already implemented the above without too much pain. The layout is all achieved relatively painlessly by having a second transform with the parent so that if `x0`, `y0` etc are in the parent's co-ordinates the subfigure has a `transFigure` given by:\r\n\r\n```python\r\n self.bbox_relative = Bbox.from_bounds(x0, y0, widthf, heightf)\r\n self.bbox = TransformedBbox(self.bbox_relative,\r\n self._parent.transFigure)\r\n self.transFigure = BboxTransformTo(self.bbox)\r\n```\r\n\r\nAnyway, wanted to throw this out there for comment or thoughts. This seems a potentially cleaner way to arrange hierarchies of subplots. \r\n\r\n\r\n","author":{"url":"https://github.com/jklymak","@type":"Person","name":"jklymak"},"datePublished":"2020-05-09T21:08:58.000Z","interactionStatistic":{"@type":"InteractionCounter","interactionType":"https://schema.org/CommentAction","userInteractionCount":8},"url":"https://github.com/17375/matplotlib/issues/17375"}| route-pattern | /_view_fragments/issues/show/:user_id/:repository/:id/issue_layout(.:format) |
| route-controller | voltron_issues_fragments |
| route-action | issue_layout |
| fetch-nonce | v2:0cc607d7-914c-4bac-6d9a-cd7b354c3a84 |
| current-catalog-service-hash | 81bb79d38c15960b92d99bca9288a9108c7a47b18f2423d0f6438c5b7bcd2114 |
| request-id | C13A:497D6:B93574:FA18F6:6A51F004 |
| html-safe-nonce | 9267066196e43f5b1ee08c0920e651d61dcf8a1c73070e75e059cb7300d80ad8 |
| visitor-payload | eyJyZWZlcnJlciI6IiIsInJlcXVlc3RfaWQiOiJDMTNBOjQ5N0Q2OkI5MzU3NDpGQTE4RjY6NkE1MUYwMDQiLCJ2aXNpdG9yX2lkIjoiNTY2NjA0NDAxMjU1OTIwMDI2MCIsInJlZ2lvbl9lZGdlIjoiaWFkIiwicmVnaW9uX3JlbmRlciI6ImlhZCJ9 |
| visitor-hmac | ffa08af197743a4ae3cb6b140bc4e4d64286c6eb5d8eaaaecf4c6d5acd80377d |
| hovercard-subject-tag | issue:615260420 |
| github-keyboard-shortcuts | repository,issues,copilot |
| google-site-verification | Apib7-x98H0j5cPqHWwSMm6dNU4GmODRoqxLiDzdx9I |
| octolytics-url | https://collector.github.com/github/collect |
| analytics-location | / |
| fb:app_id | 1401488693436528 |
| apple-itunes-app | app-id=1477376905, app-argument=https://github.com/_view_fragments/issues/show/matplotlib/matplotlib/17375/issue_layout |
| twitter:image | https://opengraph.githubassets.com/62a51b24e68083759e457b97515ecd7bcb287717da329c376fe10e8962a64489/matplotlib/matplotlib/issues/17375 |
| twitter:card | summary_large_image |
| og:image | https://opengraph.githubassets.com/62a51b24e68083759e457b97515ecd7bcb287717da329c376fe10e8962a64489/matplotlib/matplotlib/issues/17375 |
| og:image:alt | In #14421 there was some concern that gridspec was being overloaded and that something else should be doing that layout. I've mocked the following up, and it works quite well so far. Getting past m... |
| og:image:width | 1200 |
| og:image:height | 600 |
| og:site_name | GitHub |
| og:type | object |
| og:author:username | jklymak |
| hostname | github.com |
| expected-hostname | github.com |
| None | b9a586c06a05a7a86fc7e3f4dbd03e42f6869085879aa184aa6369456dbd50fb |
| turbo-cache-control | no-preview |
| go-import | github.com/matplotlib/matplotlib git https://github.com/matplotlib/matplotlib.git |
| octolytics-dimension-user_id | 215947 |
| octolytics-dimension-user_login | matplotlib |
| octolytics-dimension-repository_id | 1385122 |
| octolytics-dimension-repository_nwo | matplotlib/matplotlib |
| octolytics-dimension-repository_public | true |
| octolytics-dimension-repository_is_fork | false |
| octolytics-dimension-repository_network_root_id | 1385122 |
| octolytics-dimension-repository_network_root_nwo | matplotlib/matplotlib |
| turbo-body-classes | logged-out env-production page-responsive |
| disable-turbo | false |
| browser-stats-url | https://api.github.com/_private/browser/stats |
| browser-errors-url | https://api.github.com/_private/browser/errors |
| release | 7aed05249554b889eb33d002851a973eebcc7e91 |
| ui-target | full |
| theme-color | #1e2327 |
| color-scheme | light dark |
Links:
Viewport: width=device-width


