Title: Border issues when exporting images on version >3.0.3 · Issue #16981 · matplotlib/matplotlib · GitHub
Open Graph Title: Border issues when exporting images on version >3.0.3 · Issue #16981 · matplotlib/matplotlib
X Title: Border issues when exporting images on version >3.0.3 · Issue #16981 · matplotlib/matplotlib
Description: Bug report Bug summary We noticed weird border issues after upgrading matplotlib from 3.0.3 to higher versions. I tried searching through the open issues but I couldn't find a matching one. I also tried looking through the changelog for ...
Open Graph Description: Bug report Bug summary We noticed weird border issues after upgrading matplotlib from 3.0.3 to higher versions. I tried searching through the open issues but I couldn't find a matching one. I also ...
X Description: Bug report Bug summary We noticed weird border issues after upgrading matplotlib from 3.0.3 to higher versions. I tried searching through the open issues but I couldn't find a matching one. I a...
Opengraph URL: https://github.com/matplotlib/matplotlib/issues/16981
X: @github
Domain: github.com
{"@context":"https://schema.org","@type":"DiscussionForumPosting","headline":"Border issues when exporting images on version \u003e3.0.3","articleBody":"### Bug report\r\n\r\n**Bug summary**\r\n\r\nWe noticed weird border issues after upgrading `matplotlib` from `3.0.3` to higher versions. I tried searching through the open issues but I couldn't find a matching one. I also tried looking through the changelog for `3.1.0` but nothing stood out.\r\n\r\n**Code for reproduction**\r\n\r\nThis is a bit simplified version of what we're doing on production:\r\n\r\n```python\r\nimport io\r\n\r\nfrom matplotlib.figure import Figure\r\nfrom matplotlib.patches import Arc, Rectangle\r\nfrom matplotlib.backends.backend_agg import FigureCanvasAgg as FigureCanvas\r\n\r\ngraph_path = \"/tmp/foobar.png\"\r\n\r\nPITCH_WIDTH = 65\r\nPITCH_LENGTH = 105\r\nPITCH_SCALE = 8\r\n\r\n# Create example pitch graph\r\nfig = Figure(figsize=(PITCH_WIDTH / PITCH_SCALE, PITCH_LENGTH / PITCH_SCALE))\r\nax = fig.subplots()\r\nax.set_facecolor(\"#1e1e1e\")\r\n\r\nax.set_xlim(0, PITCH_WIDTH)\r\nax.set_ylim(0, PITCH_LENGTH)\r\n\r\npitch_borders = Rectangle(\r\n (0, 0),\r\n width=PITCH_WIDTH,\r\n height=PITCH_LENGTH,\r\n color=\"#ffffff\",\r\n fill=False,\r\n lw=2,\r\n zorder=10,\r\n)\r\nax.add_patch(pitch_borders)\r\n\r\nhalfway_line = Rectangle(\r\n (0, PITCH_LENGTH / 2),\r\n width=PITCH_WIDTH,\r\n height=0,\r\n color=\"#ffffff\",\r\n fill=False,\r\n lw=2,\r\n zorder=0,\r\n)\r\nax.add_patch(halfway_line)\r\n\r\ncentre_circle = Arc(\r\n (PITCH_WIDTH / 2, PITCH_LENGTH / 2),\r\n width=18,\r\n height=18,\r\n color=\"#ffffff\",\r\n theta1=0,\r\n theta2=360,\r\n lw=2,\r\n zorder=0,\r\n)\r\nax.add_patch(centre_circle)\r\n\r\nax.get_xaxis().set_visible(False)\r\nax.get_yaxis().set_visible(False)\r\n\r\n# Export it to bytes buffer\r\nbuffer = io.BytesIO()\r\ncanvas = FigureCanvas(fig)\r\ncanvas.print_figure(buffer, dpi=150, bbox_inches=\"tight\", pad_inches=0)\r\nbuffer.seek(0)\r\n\r\n# Save buffer to a file\r\nwith open(graph_path, \"wb\") as f:\r\n f.write(buffer.getvalue())\r\n```\r\n\r\n**Actual outcome**\r\n\r\nOn versions newer then `3.0.3` you can see weird borders on left and bottom side.\r\n\r\nOn version `3.1.3`:\r\n\r\n\r\nOn version `3.2.1`:\r\n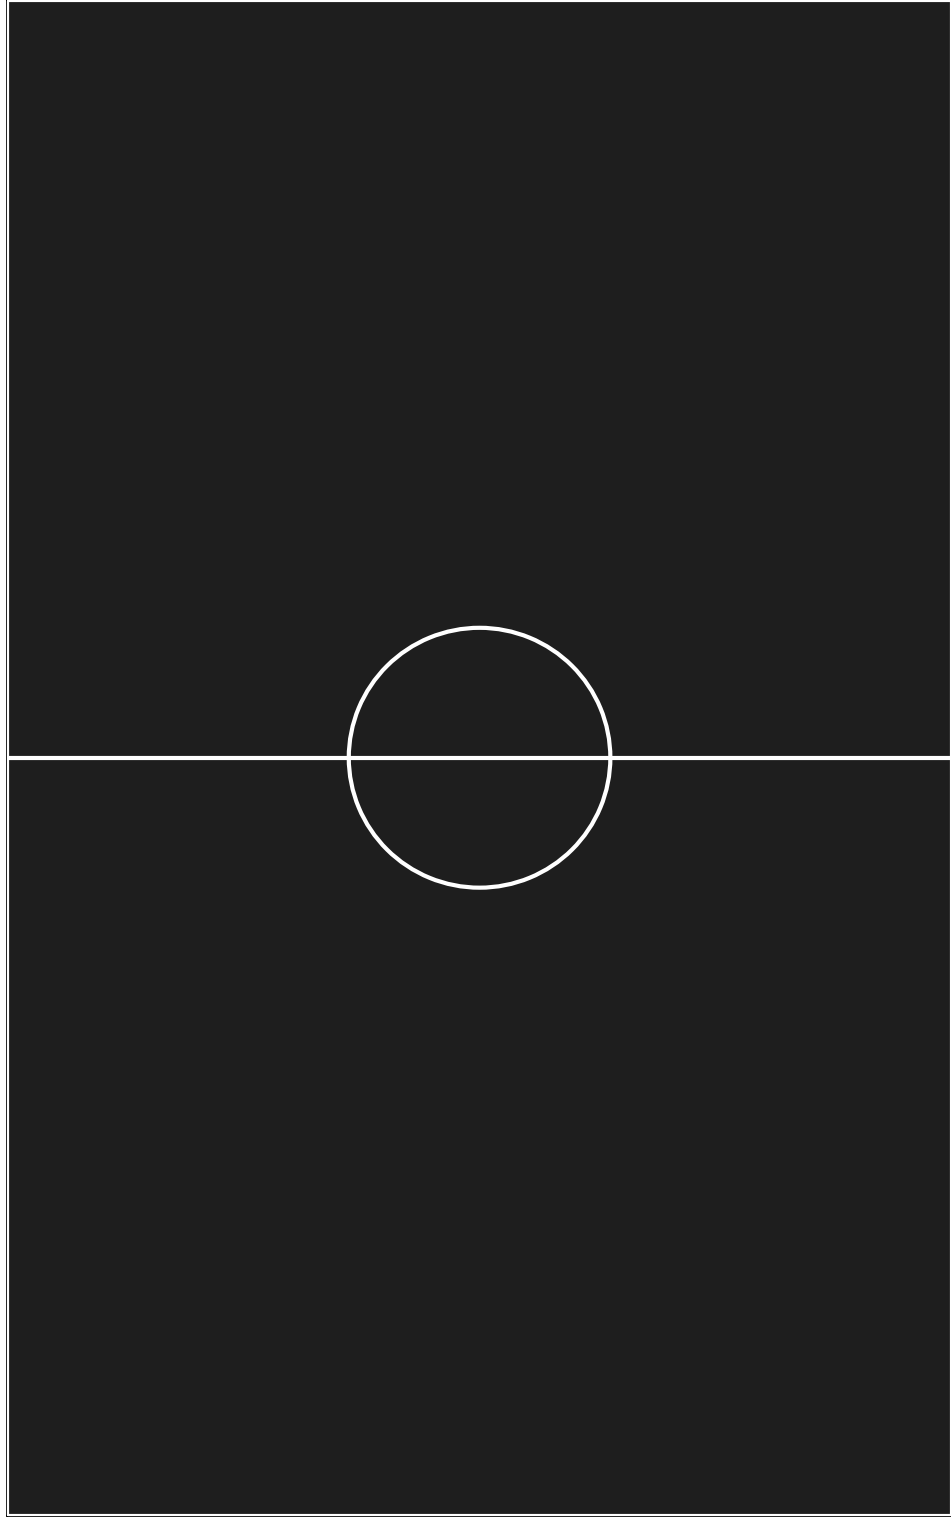\r\n\r\n**Expected outcome**\r\n\r\nOn version `3.0.3` it works as expected, without the weird borders:\r\n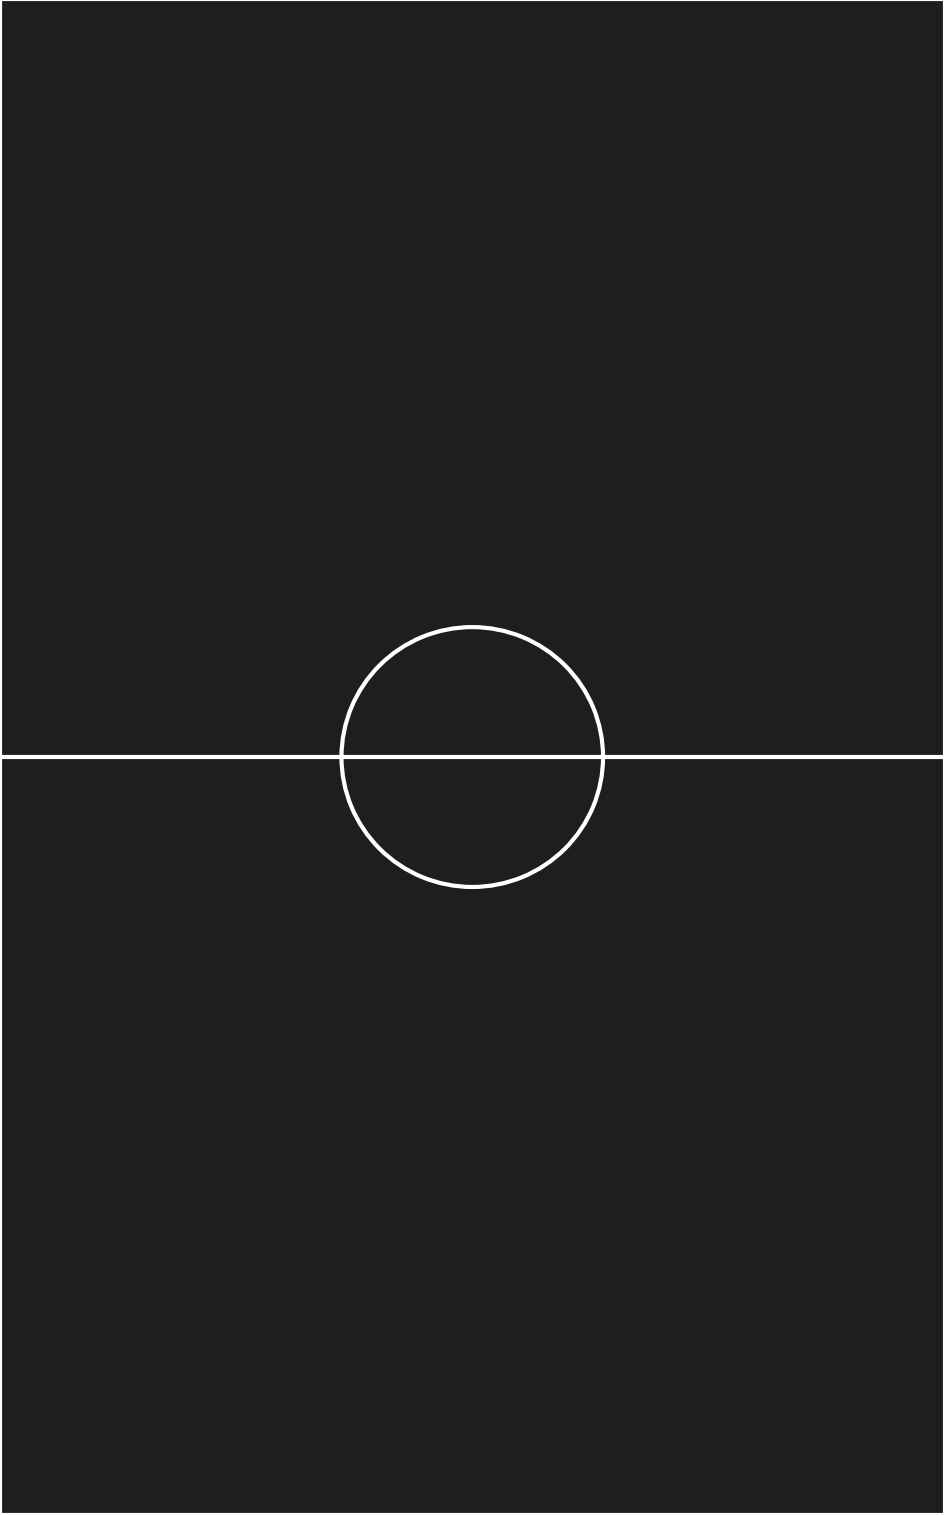\r\n\r\nWe're not sure if it's something we're doing wrong (so a fix for `matplotlib` was a regression for us) or is there a bigger bug there.\r\n\r\n**Matplotlib version**\r\n * Operating system: OS X 10.14.6\r\n * Matplotlib version: 3.2.1 (and 3.1.3)\r\n * Matplotlib backend (`print(matplotlib.get_backend())`): this returns `TkAgg`, but we explicitly use `Agg` via. `FigureCanvasAgg`\r\n * Python version: 3.7.7\r\n * Jupyter version (if applicable): n/a\r\n * Other libraries: n/a\r\n\r\nPython installed via pyenv, matplotlib installed via pip inside a virtualenv. No other extra libraries.","author":{"url":"https://github.com/pawelad","@type":"Person","name":"pawelad"},"datePublished":"2020-03-31T14:14:32.000Z","interactionStatistic":{"@type":"InteractionCounter","interactionType":"https://schema.org/CommentAction","userInteractionCount":14},"url":"https://github.com/16981/matplotlib/issues/16981"}| route-pattern | /_view_fragments/issues/show/:user_id/:repository/:id/issue_layout(.:format) |
| route-controller | voltron_issues_fragments |
| route-action | issue_layout |
| fetch-nonce | v2:6fe3f3a0-9732-61d9-4b54-ab67674d8358 |
| current-catalog-service-hash | 81bb79d38c15960b92d99bca9288a9108c7a47b18f2423d0f6438c5b7bcd2114 |
| request-id | B8D4:3D9B0D:A145FC:EB67DB:6A562048 |
| html-safe-nonce | a5e3b579ace7ca372eda43721949d89a641a97da851a1c176a075220ad8d8c62 |
| visitor-payload | eyJyZWZlcnJlciI6IiIsInJlcXVlc3RfaWQiOiJCOEQ0OjNEOUIwRDpBMTQ1RkM6RUI2N0RCOjZBNTYyMDQ4IiwidmlzaXRvcl9pZCI6IjQ1NjM5MDM5NDk1NzQwNjI4MCIsInJlZ2lvbl9lZGdlIjoiaWFkIiwicmVnaW9uX3JlbmRlciI6ImlhZCJ9 |
| visitor-hmac | f6327551436c9f9edfe77f50021a875818db05700a2ae1bde5bc6b06565d695b |
| hovercard-subject-tag | issue:591145583 |
| github-keyboard-shortcuts | repository,issues,copilot |
| google-site-verification | Apib7-x98H0j5cPqHWwSMm6dNU4GmODRoqxLiDzdx9I |
| octolytics-url | https://collector.github.com/github/collect |
| analytics-location | / |
| fb:app_id | 1401488693436528 |
| apple-itunes-app | app-id=1477376905, app-argument=https://github.com/_view_fragments/issues/show/matplotlib/matplotlib/16981/issue_layout |
| twitter:image | https://opengraph.githubassets.com/9587b81164949b574b00aa34a07fa5292e85ddf9789de6e24014ec0a3b58907a/matplotlib/matplotlib/issues/16981 |
| twitter:card | summary_large_image |
| og:image | https://opengraph.githubassets.com/9587b81164949b574b00aa34a07fa5292e85ddf9789de6e24014ec0a3b58907a/matplotlib/matplotlib/issues/16981 |
| og:image:alt | Bug report Bug summary We noticed weird border issues after upgrading matplotlib from 3.0.3 to higher versions. I tried searching through the open issues but I couldn't find a matching one. I also ... |
| og:image:width | 1200 |
| og:image:height | 600 |
| og:site_name | GitHub |
| og:type | object |
| og:author:username | pawelad |
| hostname | github.com |
| expected-hostname | github.com |
| None | eeb71977be324ce2bc7c4afd597296b8e3527d8922ad94632edd7a7296f8031b |
| turbo-cache-control | no-preview |
| go-import | github.com/matplotlib/matplotlib git https://github.com/matplotlib/matplotlib.git |
| octolytics-dimension-user_id | 215947 |
| octolytics-dimension-user_login | matplotlib |
| octolytics-dimension-repository_id | 1385122 |
| octolytics-dimension-repository_nwo | matplotlib/matplotlib |
| octolytics-dimension-repository_public | true |
| octolytics-dimension-repository_is_fork | false |
| octolytics-dimension-repository_network_root_id | 1385122 |
| octolytics-dimension-repository_network_root_nwo | matplotlib/matplotlib |
| turbo-body-classes | logged-out env-production page-responsive |
| disable-turbo | false |
| browser-stats-url | https://api.github.com/_private/browser/stats |
| browser-errors-url | https://api.github.com/_private/browser/errors |
| release | 3e7957744c8a44d05ff1e464dc5d119e60b98fae |
| ui-target | full |
| theme-color | #1e2327 |
| color-scheme | light dark |
Links:
Viewport: width=device-width


