Title: Error in Agg backend's PNG renderer when `markeredgewidth > markersize` · Issue #16621 · matplotlib/matplotlib · GitHub
Open Graph Title: Error in Agg backend's PNG renderer when `markeredgewidth > markersize` · Issue #16621 · matplotlib/matplotlib
X Title: Error in Agg backend's PNG renderer when `markeredgewidth > markersize` · Issue #16621 · matplotlib/matplotlib
Description: Bug report Bug summary Whenever the edge width of a marker is increased beyond the size of the marker, you would want the marker to Code for reproduction import matplotlib.pyplot as plt for i in range(0, 150, 20): fig, ax = plt.subplots(...
Open Graph Description: Bug report Bug summary Whenever the edge width of a marker is increased beyond the size of the marker, you would want the marker to Code for reproduction import matplotlib.pyplot as plt for i in ra...
X Description: Bug report Bug summary Whenever the edge width of a marker is increased beyond the size of the marker, you would want the marker to Code for reproduction import matplotlib.pyplot as plt for i in ra...
Opengraph URL: https://github.com/matplotlib/matplotlib/issues/16621
X: @github
Domain: github.com
{"@context":"https://schema.org","@type":"DiscussionForumPosting","headline":"Error in Agg backend's PNG renderer when `markeredgewidth \u003e markersize`","articleBody":"\u003c!--To help us understand and resolve your issue, please fill out the form to the best of your ability.--\u003e\r\n\u003c!--You can feel free to delete the sections that do not apply.--\u003e\r\n\r\n### Bug report\r\n\r\n**Bug summary**\r\n\r\nWhenever the edge width of a marker is increased beyond the size of the marker, you would want the marker to \r\n\r\n**Code for reproduction**\r\n\r\n\u003c!--A minimum code snippet required to reproduce the bug.\r\nPlease make sure to minimize the number of dependencies required, and provide\r\nany necessary plotted data.\r\nAvoid using threads, as Matplotlib is (explicitly) not thread-safe.--\u003e\r\n\r\n```python\r\nimport matplotlib.pyplot as plt\r\nfor i in range(0, 150, 20):\r\n fig, ax = plt.subplots()\r\n lines = ax.plot(0, 0, marker='p', markersize=60, markeredgewidth=i, \r\n markeredgecolor='k', clip_on=False)\r\n plt.xlim([-0.04, 0.04])\r\n plt.ylim([-0.04, 0.04])\r\n plt.savefig(f'/home/bbeltr1/Downloads/test_{i}.png')\r\nfig._cachedRenderer\r\n```\r\n\r\n**Actual outcome**\r\n\r\n\u003c!--The output produced by the above code, which may be a screenshot, console output, etc.--\u003e\r\n\r\nWhile the outer extents of the pentagon's edge appear correct, you can see that the inner extents begin to recede away from the center as the edge width is set larger and larger, until eventually the original marker is fully visible again, along with some of the background.\r\n\r\nConsole output:\r\n`\u003cmatplotlib.backends.backend_agg.RendererAgg at 0x7f5277bf0e80\u003e`\r\n\r\nSaved images:\r\n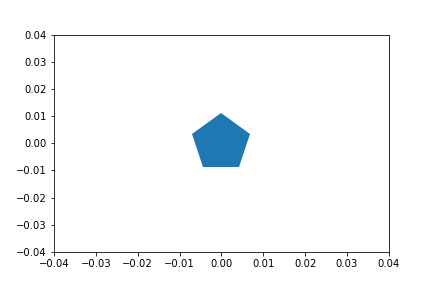\r\n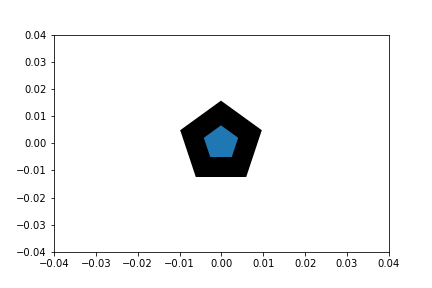\r\n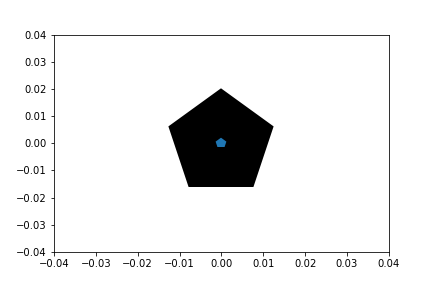\r\n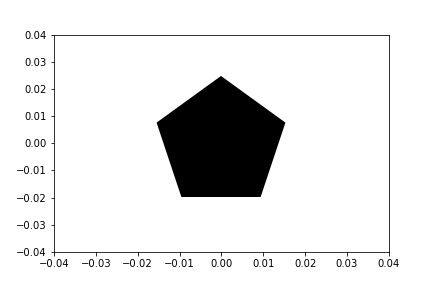\r\n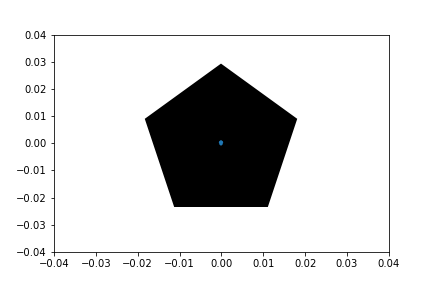\r\n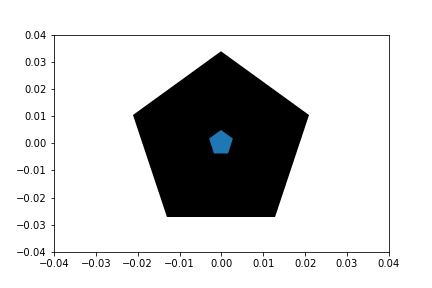\r\n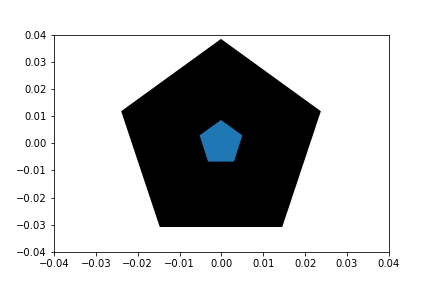\r\n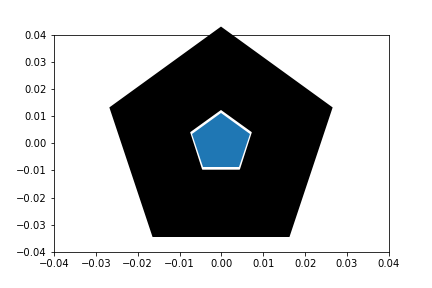\r\n\r\n\r\n**Expected outcome**\r\n\r\nThe expected outcome is a fully-shaded pentagon (due to the edge being huge). My PDF backend does this correctly, as seen below in a screenshot of what `test_140.pdf` looks like if I save as `'test_{i}.pdf'` instead:\r\n\r\n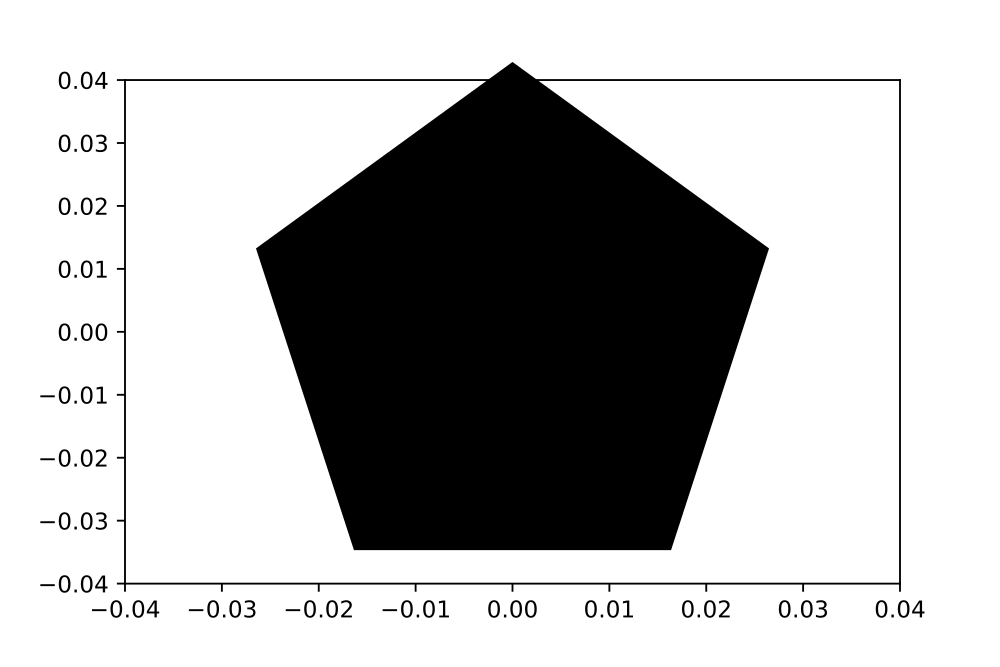\r\n\r\n\r\n**Matplotlib version**\r\n\u003c!--Please specify your platform and versions of the relevant libraries you are using:--\u003e\r\n * Operating system: Debian 9\r\n * Matplotlib version: 3.1.3\r\n * Matplotlib backend (`print(matplotlib.get_backend())`): `module://ipykernel.pylab.backend_inline` is what gets printed, and inline plots also show this error, but I can take Jupyter out of the loop by saving directly to file. Both cases are apparently using `RendererAgg` to make the PNG, as seen above.\r\n * Python version: 3.7.3\r\n * Jupyter version (if applicable):\r\n * Other libraries: \r\n\r\nMatplotlib was installed and updated via the default conda channel.\r\n\u003c!--Please tell us how you installed matplotlib and python e.g., from source, pip, conda--\u003e\r\n\u003c!--If you installed from conda, please specify which channel you used if not the default--\u003e\r\n\r\n","author":{"url":"https://github.com/brunobeltran","@type":"Person","name":"brunobeltran"},"datePublished":"2020-03-01T20:29:19.000Z","interactionStatistic":{"@type":"InteractionCounter","interactionType":"https://schema.org/CommentAction","userInteractionCount":6},"url":"https://github.com/16621/matplotlib/issues/16621"}| route-pattern | /_view_fragments/issues/show/:user_id/:repository/:id/issue_layout(.:format) |
| route-controller | voltron_issues_fragments |
| route-action | issue_layout |
| fetch-nonce | v2:66243d57-8c97-8ed3-13ef-725dc00486f4 |
| current-catalog-service-hash | 81bb79d38c15960b92d99bca9288a9108c7a47b18f2423d0f6438c5b7bcd2114 |
| request-id | A2A4:13F494:111C0D:171044:6A515D0C |
| html-safe-nonce | 4ab50e25993c79d25c9b86f1ae3cdb90d6dab97f87c16bd12f80e7052ac3376a |
| visitor-payload | eyJyZWZlcnJlciI6IiIsInJlcXVlc3RfaWQiOiJBMkE0OjEzRjQ5NDoxMTFDMEQ6MTcxMDQ0OjZBNTE1RDBDIiwidmlzaXRvcl9pZCI6IjE3MTIyODYzMTMxNzA5NTE0MzYiLCJyZWdpb25fZWRnZSI6ImlhZCIsInJlZ2lvbl9yZW5kZXIiOiJpYWQifQ== |
| visitor-hmac | 5c3fe7c2bda95f131870a78c1338a4a839bddb842e81b1552a2b42e76e3f15c5 |
| hovercard-subject-tag | issue:573609761 |
| github-keyboard-shortcuts | repository,issues,copilot |
| google-site-verification | Apib7-x98H0j5cPqHWwSMm6dNU4GmODRoqxLiDzdx9I |
| octolytics-url | https://collector.github.com/github/collect |
| analytics-location | / |
| fb:app_id | 1401488693436528 |
| apple-itunes-app | app-id=1477376905, app-argument=https://github.com/_view_fragments/issues/show/matplotlib/matplotlib/16621/issue_layout |
| twitter:image | https://opengraph.githubassets.com/6d14dc95507ce11457eb47aaf6e731bbd707f7fa19cecbe2861097d9b93fcee1/matplotlib/matplotlib/issues/16621 |
| twitter:card | summary_large_image |
| og:image | https://opengraph.githubassets.com/6d14dc95507ce11457eb47aaf6e731bbd707f7fa19cecbe2861097d9b93fcee1/matplotlib/matplotlib/issues/16621 |
| og:image:alt | Bug report Bug summary Whenever the edge width of a marker is increased beyond the size of the marker, you would want the marker to Code for reproduction import matplotlib.pyplot as plt for i in ra... |
| og:image:width | 1200 |
| og:image:height | 600 |
| og:site_name | GitHub |
| og:type | object |
| og:author:username | brunobeltran |
| hostname | github.com |
| expected-hostname | github.com |
| None | b9a586c06a05a7a86fc7e3f4dbd03e42f6869085879aa184aa6369456dbd50fb |
| turbo-cache-control | no-preview |
| go-import | github.com/matplotlib/matplotlib git https://github.com/matplotlib/matplotlib.git |
| octolytics-dimension-user_id | 215947 |
| octolytics-dimension-user_login | matplotlib |
| octolytics-dimension-repository_id | 1385122 |
| octolytics-dimension-repository_nwo | matplotlib/matplotlib |
| octolytics-dimension-repository_public | true |
| octolytics-dimension-repository_is_fork | false |
| octolytics-dimension-repository_network_root_id | 1385122 |
| octolytics-dimension-repository_network_root_nwo | matplotlib/matplotlib |
| turbo-body-classes | logged-out env-production page-responsive |
| disable-turbo | false |
| browser-stats-url | https://api.github.com/_private/browser/stats |
| browser-errors-url | https://api.github.com/_private/browser/errors |
| release | 2eeb434949a926fad21064b4d395a54759f7a0b2 |
| ui-target | full |
| theme-color | #1e2327 |
| color-scheme | light dark |
Links:
Viewport: width=device-width


