Title: incorrect cbar minor ticks for extend regions when x/ytick.minor.visible is True · Issue #16468 · matplotlib/matplotlib · GitHub
Open Graph Title: incorrect cbar minor ticks for extend regions when x/ytick.minor.visible is True · Issue #16468 · matplotlib/matplotlib
X Title: incorrect cbar minor ticks for extend regions when x/ytick.minor.visible is True · Issue #16468 · matplotlib/matplotlib
Description: Bug report Bug summary Colorbars have their own minorticks_on/off methods to address the issue of minorticks extending into the "extend" regions (see #11584). Since colorbar axes are instances of normal axes, setting rcParams['y/xtick.mi...
Open Graph Description: Bug report Bug summary Colorbars have their own minorticks_on/off methods to address the issue of minorticks extending into the "extend" regions (see #11584). Since colorbar axes are instances of n...
X Description: Bug report Bug summary Colorbars have their own minorticks_on/off methods to address the issue of minorticks extending into the "extend" regions (see #11584). Since colorbar axes are inst...
Opengraph URL: https://github.com/matplotlib/matplotlib/issues/16468
X: @github
Domain: github.com
{"@context":"https://schema.org","@type":"DiscussionForumPosting","headline":"incorrect cbar minor ticks for extend regions when x/ytick.minor.visible is True","articleBody":"\u003c!--To help us understand and resolve your issue, please fill out the form to the best of your ability.--\u003e\r\n\u003c!--You can feel free to delete the sections that do not apply.--\u003e\r\n\r\n### Bug report\r\n\r\n**Bug summary**\r\nColorbars have their own `minorticks_on/off` methods to address the issue of minorticks extending into the \"extend\" regions (see #11584).\r\n\r\nSince colorbar axes are instances of normal axes, setting `rcParams['y/xtick.minor.visible'] = True`\r\nresults in minorticks being drawn on the colorbar axes using the axes methods (which don't take into account the \"extend\" regions). \r\n\r\n\r\n\r\n**Code for reproduction**\r\n```python\r\nimport matplotlib.pyplot as plt\r\nimport numpy as np\r\n\r\n# Making yticks longer in length to highlight the issue\r\nplt.rcParams['ytick.major.size'] = 10\r\nplt.rcParams['ytick.minor.size'] = 4\r\nplt.rcParams['ytick.minor.visible'] = True\r\n# Similar issue with plt.rcParams['xtick.minor.visible'] = True and horizontal colorbar\r\n\r\nnp.random.seed(seed=12345)\r\nx = np.random.randn(20, 20)\r\nfig, ax = plt.subplots(figsize=(4, 3), constrained_layout=True)\r\nim = ax.pcolormesh(x)\r\n\r\ncbar = fig.colorbar(im, extend='both', orientation='vertical')\r\n# Similar issue with plt.rcParams['xtick.minor.visible'] = True and horizontal colorbar\r\nfig.savefig('cbar_minorticks_issue.png')\r\n```\r\n\u003c!--A minimum code snippet required to reproduce the bug.\r\nPlease make sure to minimize the number of dependencies required, and provide\r\nany necessary plotted data.\r\nAvoid using threads, as Matplotlib is (explicitly) not thread-safe.--\u003e\r\n\r\n\r\n**Actual outcome**\r\n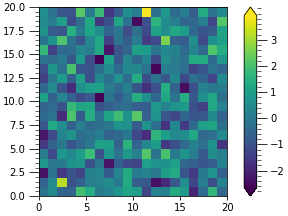\r\n \r\n**Expected outcome**\r\n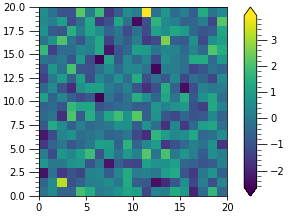 \r\n\r\n**Matplotlib version**\r\n\u003c!--Please specify your platform and versions of the relevant libraries you are using:--\u003e\r\n * Operating system:\r\n * Matplotlib version: \r\n * Matplotlib backend (`print(matplotlib.get_backend())`):\r\n * Python version:\r\n * Jupyter version (if applicable):\r\n * Other libraries: \r\n\r\n\u003c!--Please tell us how you installed matplotlib and python e.g., from source, pip, conda--\u003e\r\n\u003c!--If you installed from conda, please specify which channel you used if not the default--\u003e\r\n\r\n","author":{"url":"https://github.com/pharshalp","@type":"Person","name":"pharshalp"},"datePublished":"2020-02-11T00:21:29.000Z","interactionStatistic":{"@type":"InteractionCounter","interactionType":"https://schema.org/CommentAction","userInteractionCount":0},"url":"https://github.com/16468/matplotlib/issues/16468"}| route-pattern | /_view_fragments/issues/show/:user_id/:repository/:id/issue_layout(.:format) |
| route-controller | voltron_issues_fragments |
| route-action | issue_layout |
| fetch-nonce | v2:425749a9-d7f5-703c-1799-56f0e40afded |
| current-catalog-service-hash | 81bb79d38c15960b92d99bca9288a9108c7a47b18f2423d0f6438c5b7bcd2114 |
| request-id | A54A:2A9631:BC11CB:1026F7E:6A55B941 |
| html-safe-nonce | 600424145c8c14001db68c871a70f3d129e8791d9bfcebf655205dda1533278b |
| visitor-payload | eyJyZWZlcnJlciI6IiIsInJlcXVlc3RfaWQiOiJBNTRBOjJBOTYzMTpCQzExQ0I6MTAyNkY3RTo2QTU1Qjk0MSIsInZpc2l0b3JfaWQiOiI4MDkwMTgxMjc4NzgyMzA2NjI1IiwicmVnaW9uX2VkZ2UiOiJpYWQiLCJyZWdpb25fcmVuZGVyIjoiaWFkIn0= |
| visitor-hmac | 941c98861d2d1686118719849f0a40becf1b09dfbfd81d49fcd902cd7e117231 |
| hovercard-subject-tag | issue:562908069 |
| github-keyboard-shortcuts | repository,issues,copilot |
| google-site-verification | Apib7-x98H0j5cPqHWwSMm6dNU4GmODRoqxLiDzdx9I |
| octolytics-url | https://collector.github.com/github/collect |
| analytics-location | / |
| fb:app_id | 1401488693436528 |
| apple-itunes-app | app-id=1477376905, app-argument=https://github.com/_view_fragments/issues/show/matplotlib/matplotlib/16468/issue_layout |
| twitter:image | https://opengraph.githubassets.com/83ba8170814b05482738de13b44af3ba33a167f88f9e8e91c4bd75f7f361dd52/matplotlib/matplotlib/issues/16468 |
| twitter:card | summary_large_image |
| og:image | https://opengraph.githubassets.com/83ba8170814b05482738de13b44af3ba33a167f88f9e8e91c4bd75f7f361dd52/matplotlib/matplotlib/issues/16468 |
| og:image:alt | Bug report Bug summary Colorbars have their own minorticks_on/off methods to address the issue of minorticks extending into the "extend" regions (see #11584). Since colorbar axes are instances of n... |
| og:image:width | 1200 |
| og:image:height | 600 |
| og:site_name | GitHub |
| og:type | object |
| og:author:username | pharshalp |
| hostname | github.com |
| expected-hostname | github.com |
| None | b5665c84831ed9ac4fb79519c16c9c5580ba8092fb8bb6e3e72972ec7197348e |
| turbo-cache-control | no-preview |
| go-import | github.com/matplotlib/matplotlib git https://github.com/matplotlib/matplotlib.git |
| octolytics-dimension-user_id | 215947 |
| octolytics-dimension-user_login | matplotlib |
| octolytics-dimension-repository_id | 1385122 |
| octolytics-dimension-repository_nwo | matplotlib/matplotlib |
| octolytics-dimension-repository_public | true |
| octolytics-dimension-repository_is_fork | false |
| octolytics-dimension-repository_network_root_id | 1385122 |
| octolytics-dimension-repository_network_root_nwo | matplotlib/matplotlib |
| turbo-body-classes | logged-out env-production page-responsive |
| disable-turbo | false |
| browser-stats-url | https://api.github.com/_private/browser/stats |
| browser-errors-url | https://api.github.com/_private/browser/errors |
| release | 64b9ae238e18eb87ead1f9fe37a7cc81d67d85aa |
| ui-target | full |
| theme-color | #1e2327 |
| color-scheme | light dark |
Links:
Viewport: width=device-width

