Title: secondary axis fails to respect major tick locator · Issue #16416 · matplotlib/matplotlib · GitHub
Open Graph Title: secondary axis fails to respect major tick locator · Issue #16416 · matplotlib/matplotlib
X Title: secondary axis fails to respect major tick locator · Issue #16416 · matplotlib/matplotlib
Description: Bug report Y tick locations on secondary y-axis are ignored I create a secondary y-axis on a plot and set custom y tick locations. But my specified tick locations get ignored. In this example the right hand y-axis should have ticks at po...
Open Graph Description: Bug report Y tick locations on secondary y-axis are ignored I create a secondary y-axis on a plot and set custom y tick locations. But my specified tick locations get ignored. In this example the r...
X Description: Bug report Y tick locations on secondary y-axis are ignored I create a secondary y-axis on a plot and set custom y tick locations. But my specified tick locations get ignored. In this example the r...
Opengraph URL: https://github.com/matplotlib/matplotlib/issues/16416
X: @github
Domain: github.com
{"@context":"https://schema.org","@type":"DiscussionForumPosting","headline":"secondary axis fails to respect major tick locator","articleBody":"\u003c!--To help us understand and resolve your issue, please fill out the form to the best of your ability.--\u003e\r\n\u003c!--You can feel free to delete the sections that do not apply.--\u003e\r\n\r\n### Bug report\r\n\r\n**Y tick locations on secondary y-axis are ignored**\r\n\r\nI create a secondary y-axis on a plot and set custom y tick locations. But my specified tick locations get ignored. In this example the right hand y-axis should have ticks at positions [1, 2, 5, 10].\r\n\r\n**Code for reproduction**\r\n\r\n\u003c!--A minimum code snippet required to reproduce the bug.\r\nPlease make sure to minimize the number of dependencies required, and provide\r\nany necessary plotted data.\r\nAvoid using threads, as Matplotlib is (explicitly) not thread-safe.--\u003e\r\n\r\n```python\r\n\r\nimport numpy as np\r\nimport matplotlib.pyplot as plt\r\n\r\nfig, ax = plt.subplots()\r\n\r\nx = np.arange(1, 100)\r\ny = np.sqrt(x)\r\nax.plot(x, y)\r\nax.set_xlim(0, 100)\r\nax.set_ylim(1, 10)\r\nsecax = ax.secondary_yaxis('right', functions=(lambda z: 10*np.log10(z), lambda z: np.power(10.0, z/10.0)))\r\n# Secondary y-axis tick locations get ignored.\r\nsecax.set_yticks([1, 2, 5, 10])\r\nplt.show()\r\nplt.close()\r\n```\r\n\r\n**Actual outcome**\r\n\r\n\u003c!--The output produced by the above code, which may be a screenshot, console output, etc.--\u003e\r\n\r\n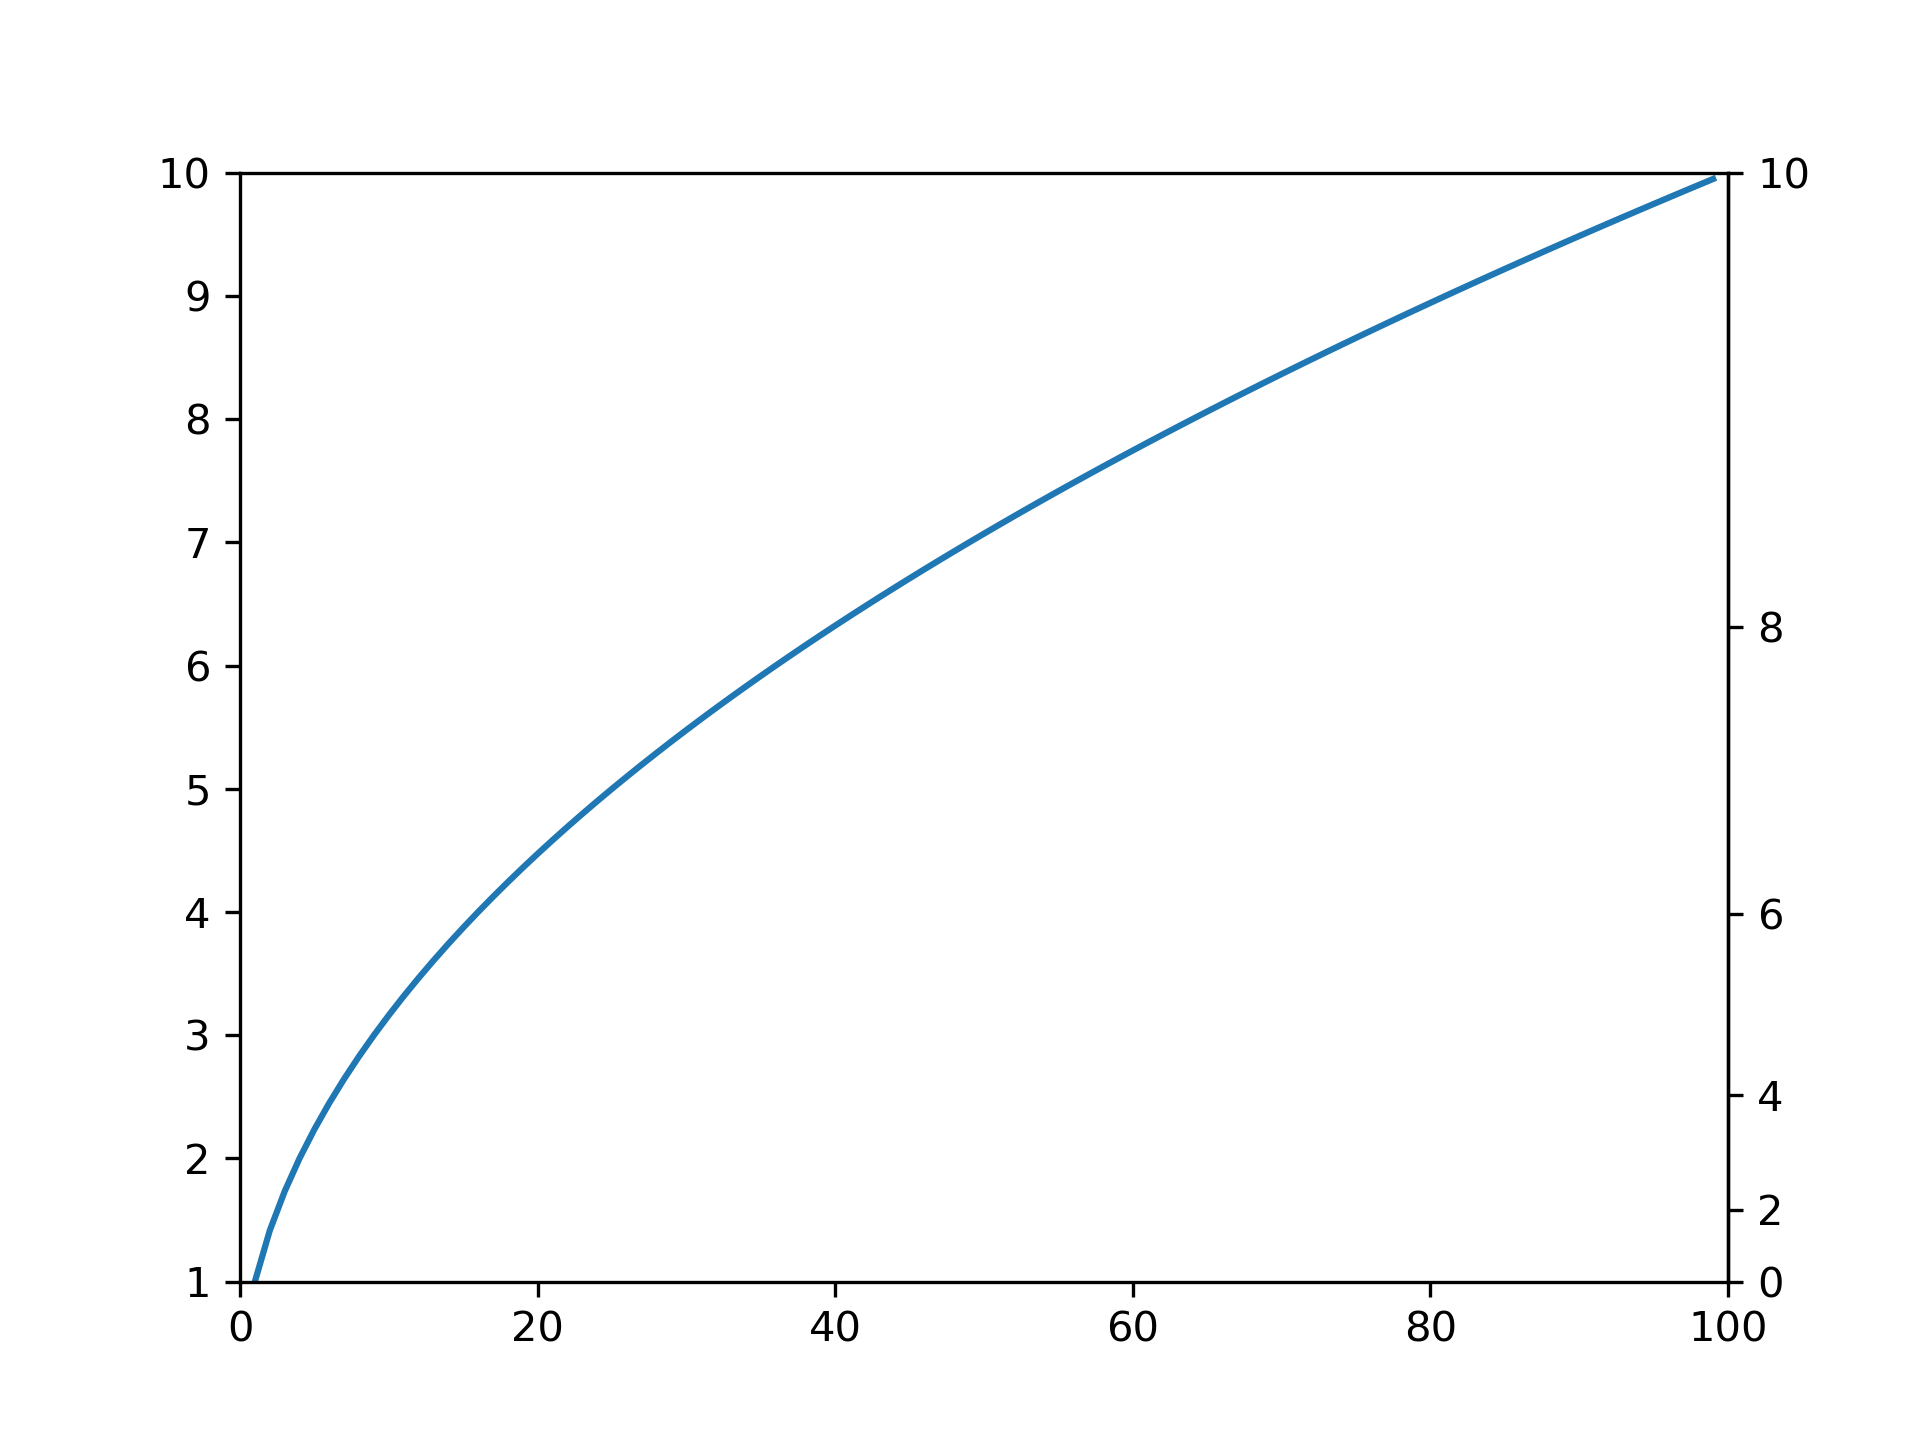\r\n\r\n**Expected outcome**\r\n\r\n\u003c!--A description of the expected outcome from the code snippet--\u003e\r\n\u003c!--If this used to work in an earlier version of Matplotlib, please note the version it used to work on--\u003e\r\n\r\nI expect the right hand y-axis to be labeled with ticks at positions [1, 2, 5, 10], not [0, 2, 4, 6, 8, 10]. If I try to force this by using `matplotlib.tickerFixedLocator`, I still see the same problem.\r\n\r\n**Matplotlib version**\r\n\u003c!--Please specify your platform and versions of the relevant libraries you are using:--\u003e\r\n * Operating system: Windows 10 Build 10.0.18363\r\n * Matplotlib version: 3.1.3\r\n * Matplotlib backend (`print(matplotlib.get_backend())`): Qt5Agg\r\n * Python version: Python 3.7.4 (default, Aug 9 2019, 18:34:13) [MSC v.1915 64 bit (AMD64)] :: Anaconda, Inc. on win32\r\n * Jupyter version (if applicable): N/A\r\n * Other libraries: \r\n```\r\n# packages in environment at C:\\Miniconda3:\r\n#\r\n# Name Version Build Channel\r\nasn1crypto 1.3.0 py37_0\r\nastroid 2.3.3 py37_0\r\nblas 1.0 mkl\r\nca-certificates 2020.1.1 0\r\ncertifi 2019.11.28 py37_0\r\ncffi 1.13.2 py37h7a1dbc1_0\r\nchardet 3.0.4 py37_1003\r\ncolorama 0.4.3 py_0\r\nconda 4.8.2 py37_0\r\nconda-package-handling 1.6.0 py37h62dcd97_0\r\nconsole_shortcut 0.1.1 3\r\ncryptography 2.8 py37h7a1dbc1_0\r\ncycler 0.10.0 py37_0\r\nfreetype 2.9.1 ha9979f8_1\r\nicc_rt 2019.0.0 h0cc432a_1\r\nicu 58.2 ha66f8fd_1\r\nidna 2.8 py37_0\r\nintel-openmp 2019.4 245\r\nisort 4.3.21 py37_0\r\njpeg 9b hb83a4c4_2\r\nkiwisolver 1.1.0 py37ha925a31_0\r\nlazy-object-proxy 1.4.3 py37he774522_0\r\nlibpng 1.6.37 h2a8f88b_0\r\nmatplotlib 3.1.3 py37_0\r\nmatplotlib-base 3.1.3 py37h64f37c6_0\r\nmccabe 0.6.1 py37_1\r\nmenuinst 1.4.16 py37he774522_0\r\nmkl 2019.4 245\r\nmkl-service 2.3.0 py37hb782905_0\r\nmkl_fft 1.0.15 py37h14836fe_0\r\nmkl_random 1.1.0 py37h675688f_0\r\nnumpy 1.18.1 py37h93ca92e_0\r\nnumpy-base 1.18.1 py37hc3f5095_1\r\nopenssl 1.1.1d he774522_3\r\npandas 0.25.3 py37ha925a31_0\r\npatsy 0.5.1 py37_0\r\npip 20.0.2 py37_1\r\npowershell_shortcut 0.0.1 2\r\npycosat 0.6.3 py37he774522_0\r\npycparser 2.19 py37_0\r\npylint 2.4.4 py37_0\r\npyopenssl 19.1.0 py37_0\r\npyparsing 2.4.6 py_0\r\npyqt 5.9.2 py37h6538335_2\r\npysocks 1.7.1 py37_0\r\npython 3.7.4 h5263a28_0\r\npython-dateutil 2.8.1 py_0\r\npytz 2019.3 py_0\r\npywin32 227 py37he774522_1\r\nqt 5.9.7 vc14h73c81de_0\r\nrequests 2.22.0 py37_1\r\nruamel_yaml 0.15.87 py37he774522_0\r\nscipy 1.3.2 py37h29ff71c_0\r\nseaborn 0.9.0 pyh91ea838_1\r\nsetuptools 45.1.0 py37_0\r\nsip 4.19.8 py37h6538335_0\r\nsix 1.14.0 py37_0\r\nsqlite 3.31.1 he774522_0\r\nstatsmodels 0.11.0 py37he774522_0\r\ntornado 6.0.3 py37he774522_0\r\ntqdm 4.42.0 py_0\r\nurllib3 1.25.8 py37_0\r\nvc 14.1 h0510ff6_4\r\nvs2015_runtime 14.16.27012 hf0eaf9b_1\r\nwheel 0.34.2 py37_0\r\nwin_inet_pton 1.1.0 py37_0\r\nwincertstore 0.2 py37_0\r\nwrapt 1.11.2 py37he774522_0\r\nxlrd 1.2.0 py37_0\r\nyaml 0.1.7 hc54c509_2\r\nzlib 1.2.11 h62dcd97_3\r\n```\r\n\r\n\u003c!--Please tell us how you installed matplotlib and python e.g., from source, pip, conda--\u003e\r\n\u003c!--If you installed from conda, please specify which channel you used if not the default--\u003e\r\n\r\nInstalled via Miniconda distro, standard channels for packages.","author":{"url":"https://github.com/amedlin","@type":"Person","name":"amedlin"},"datePublished":"2020-02-05T12:23:21.000Z","interactionStatistic":{"@type":"InteractionCounter","interactionType":"https://schema.org/CommentAction","userInteractionCount":2},"url":"https://github.com/16416/matplotlib/issues/16416"}| route-pattern | /_view_fragments/issues/show/:user_id/:repository/:id/issue_layout(.:format) |
| route-controller | voltron_issues_fragments |
| route-action | issue_layout |
| fetch-nonce | v2:dca858e4-32c0-6948-0cdc-65ca85fbaab7 |
| current-catalog-service-hash | 81bb79d38c15960b92d99bca9288a9108c7a47b18f2423d0f6438c5b7bcd2114 |
| request-id | 9EA6:1CCBDE:634E20:84C0CC:6A52FEF1 |
| html-safe-nonce | 10f22b829979370d03d3a982be62fa408ce54d4462c73f10952a03682f2510a0 |
| visitor-payload | eyJyZWZlcnJlciI6IiIsInJlcXVlc3RfaWQiOiI5RUE2OjFDQ0JERTo2MzRFMjA6ODRDMENDOjZBNTJGRUYxIiwidmlzaXRvcl9pZCI6IjQwNDcxODY5NDkzOTU2NDQxNDUiLCJyZWdpb25fZWRnZSI6ImlhZCIsInJlZ2lvbl9yZW5kZXIiOiJpYWQifQ== |
| visitor-hmac | f62205c59be2648fa6bb4c8696ee4047aea10868510d93c6a41a767c87bad6f9 |
| hovercard-subject-tag | issue:560337576 |
| github-keyboard-shortcuts | repository,issues,copilot |
| google-site-verification | Apib7-x98H0j5cPqHWwSMm6dNU4GmODRoqxLiDzdx9I |
| octolytics-url | https://collector.github.com/github/collect |
| analytics-location | / |
| fb:app_id | 1401488693436528 |
| apple-itunes-app | app-id=1477376905, app-argument=https://github.com/_view_fragments/issues/show/matplotlib/matplotlib/16416/issue_layout |
| twitter:image | https://opengraph.githubassets.com/a5c8fba331ec0f743ed94d9216fc92352a0192a5aa2a0d1ae4db16a1c1e97a7d/matplotlib/matplotlib/issues/16416 |
| twitter:card | summary_large_image |
| og:image | https://opengraph.githubassets.com/a5c8fba331ec0f743ed94d9216fc92352a0192a5aa2a0d1ae4db16a1c1e97a7d/matplotlib/matplotlib/issues/16416 |
| og:image:alt | Bug report Y tick locations on secondary y-axis are ignored I create a secondary y-axis on a plot and set custom y tick locations. But my specified tick locations get ignored. In this example the r... |
| og:image:width | 1200 |
| og:image:height | 600 |
| og:site_name | GitHub |
| og:type | object |
| og:author:username | amedlin |
| hostname | github.com |
| expected-hostname | github.com |
| None | b9a586c06a05a7a86fc7e3f4dbd03e42f6869085879aa184aa6369456dbd50fb |
| turbo-cache-control | no-preview |
| go-import | github.com/matplotlib/matplotlib git https://github.com/matplotlib/matplotlib.git |
| octolytics-dimension-user_id | 215947 |
| octolytics-dimension-user_login | matplotlib |
| octolytics-dimension-repository_id | 1385122 |
| octolytics-dimension-repository_nwo | matplotlib/matplotlib |
| octolytics-dimension-repository_public | true |
| octolytics-dimension-repository_is_fork | false |
| octolytics-dimension-repository_network_root_id | 1385122 |
| octolytics-dimension-repository_network_root_nwo | matplotlib/matplotlib |
| turbo-body-classes | logged-out env-production page-responsive |
| disable-turbo | false |
| browser-stats-url | https://api.github.com/_private/browser/stats |
| browser-errors-url | https://api.github.com/_private/browser/errors |
| release | 07a982c1d40157c619b364352b704c3ce66bb332 |
| ui-target | full |
| theme-color | #1e2327 |
| color-scheme | light dark |
Links:
Viewport: width=device-width
