Title: Patch 3.1.1 broke imshow() heatmaps: Tiles cut off on y-axis · Issue #15179 · matplotlib/matplotlib · GitHub
Open Graph Title: Patch 3.1.1 broke imshow() heatmaps: Tiles cut off on y-axis · Issue #15179 · matplotlib/matplotlib
X Title: Patch 3.1.1 broke imshow() heatmaps: Tiles cut off on y-axis · Issue #15179 · matplotlib/matplotlib
Description: Bug report Bug summary Matplotlib patch 3.1.1 broke imshow() heatmaps. While with version 3.1.0 the heatmap was plotted correctly, in 3.1.1 the bottom most and the top most heatmap tiles are cut off. This can even be seen in the Matplotl...
Open Graph Description: Bug report Bug summary Matplotlib patch 3.1.1 broke imshow() heatmaps. While with version 3.1.0 the heatmap was plotted correctly, in 3.1.1 the bottom most and the top most heatmap tiles are cut of...
X Description: Bug report Bug summary Matplotlib patch 3.1.1 broke imshow() heatmaps. While with version 3.1.0 the heatmap was plotted correctly, in 3.1.1 the bottom most and the top most heatmap tiles are cut of...
Opengraph URL: https://github.com/matplotlib/matplotlib/issues/15179
X: @github
Domain: github.com
{"@context":"https://schema.org","@type":"DiscussionForumPosting","headline":"Patch 3.1.1 broke imshow() heatmaps: Tiles cut off on y-axis","articleBody":"### Bug report\r\n\r\n**Bug summary**\r\n\r\nMatplotlib patch 3.1.1 broke imshow() heatmaps. While with version 3.1.0 the heatmap was plotted correctly, in 3.1.1 the bottom most and the top most heatmap tiles are cut off.\r\nThis can even be seen in the Matplotlib online documentation itself, see links below.\r\n\r\n**Code for reproduction**\r\n\r\nTaken straight from the Matplotlib online documentation:\r\n```python\r\nimport numpy as np\r\nimport matplotlib\r\nimport matplotlib.pyplot as plt\r\n# sphinx_gallery_thumbnail_number = 2\r\n\r\nvegetables = [\"cucumber\", \"tomato\", \"lettuce\", \"asparagus\",\r\n \"potato\", \"wheat\", \"barley\"]\r\nfarmers = [\"Farmer Joe\", \"Upland Bros.\", \"Smith Gardening\",\r\n \"Agrifun\", \"Organiculture\", \"BioGoods Ltd.\", \"Cornylee Corp.\"]\r\n\r\nharvest = np.array([[0.8, 2.4, 2.5, 3.9, 0.0, 4.0, 0.0],\r\n [2.4, 0.0, 4.0, 1.0, 2.7, 0.0, 0.0],\r\n [1.1, 2.4, 0.8, 4.3, 1.9, 4.4, 0.0],\r\n [0.6, 0.0, 0.3, 0.0, 3.1, 0.0, 0.0],\r\n [0.7, 1.7, 0.6, 2.6, 2.2, 6.2, 0.0],\r\n [1.3, 1.2, 0.0, 0.0, 0.0, 3.2, 5.1],\r\n [0.1, 2.0, 0.0, 1.4, 0.0, 1.9, 6.3]])\r\n\r\n\r\nfig, ax = plt.subplots()\r\nim = ax.imshow(harvest)\r\n\r\n# We want to show all ticks...\r\nax.set_xticks(np.arange(len(farmers)))\r\nax.set_yticks(np.arange(len(vegetables)))\r\n# ... and label them with the respective list entries\r\nax.set_xticklabels(farmers)\r\nax.set_yticklabels(vegetables)\r\n\r\n# Rotate the tick labels and set their alignment.\r\nplt.setp(ax.get_xticklabels(), rotation=45, ha=\"right\",\r\n rotation_mode=\"anchor\")\r\n\r\n# Loop over data dimensions and create text annotations.\r\nfor i in range(len(vegetables)):\r\n for j in range(len(farmers)):\r\n text = ax.text(j, i, harvest[i, j],\r\n ha=\"center\", va=\"center\", color=\"w\")\r\n\r\nax.set_title(\"Harvest of local farmers (in tons/year)\")\r\nfig.tight_layout()\r\nplt.show()\r\n```\r\n\r\n**Actual outcome**\r\n\r\n\r\nCopied from:\r\nhttps://matplotlib.org/3.1.1/gallery/images_contours_and_fields/image_annotated_heatmap.html#sphx-glr-gallery-images-contours-and-fields-image-annotated-heatmap-py\r\n\r\n\r\n**Expected outcome**\r\n\r\n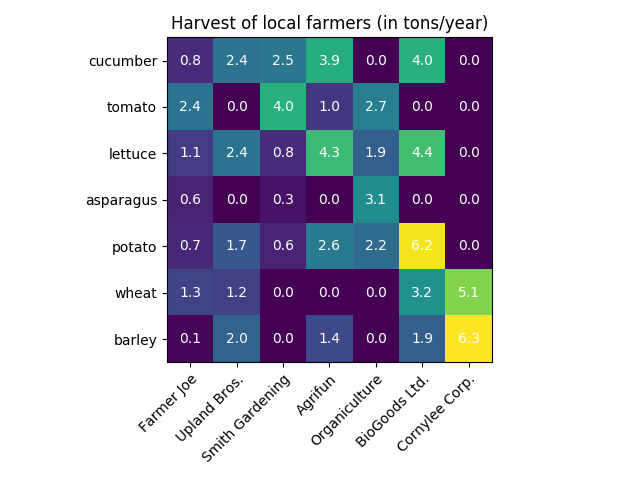\r\nCopied from:\r\nhttps://matplotlib.org/3.1.0/gallery/images_contours_and_fields/image_annotated_heatmap.html#sphx-glr-gallery-images-contours-and-fields-image-annotated-heatmap-py\r\n\r\n**Matplotlib version**\r\n\u003c!--Please specify your platform and versions of the relevant libraries you are using:--\u003e\r\n * Operating system: Windows 8.1 and Ubuntu 18.04\r\n * Matplotlib version: 3.1.1\r\n * Matplotlib backend: Qt5Agg\r\n * Python version: 3.7.4 on Windows and 3.6.8 on Ubuntu\r\n\r\nI am using conda on Windows and pip on Ubuntu.","author":{"url":"https://github.com/svdHero","@type":"Person","name":"svdHero"},"datePublished":"2019-09-04T06:06:48.000Z","interactionStatistic":{"@type":"InteractionCounter","interactionType":"https://schema.org/CommentAction","userInteractionCount":1},"url":"https://github.com/15179/matplotlib/issues/15179"}| route-pattern | /_view_fragments/issues/show/:user_id/:repository/:id/issue_layout(.:format) |
| route-controller | voltron_issues_fragments |
| route-action | issue_layout |
| fetch-nonce | v2:ed66adbf-7795-7449-76f9-835eba3874d5 |
| current-catalog-service-hash | 81bb79d38c15960b92d99bca9288a9108c7a47b18f2423d0f6438c5b7bcd2114 |
| request-id | AA8A:2AE5C2:2675123:37AF547:6A5507BE |
| html-safe-nonce | e1c59558c16a97187e81e8c2c73b3d5663d62ddf7c4cd699a341cdaf8890ccb0 |
| visitor-payload | eyJyZWZlcnJlciI6IiIsInJlcXVlc3RfaWQiOiJBQThBOjJBRTVDMjoyNjc1MTIzOjM3QUY1NDc6NkE1NTA3QkUiLCJ2aXNpdG9yX2lkIjoiNjk3MzI1NTI0MjI0ODE2MTIxNCIsInJlZ2lvbl9lZGdlIjoiaWFkIiwicmVnaW9uX3JlbmRlciI6ImlhZCJ9 |
| visitor-hmac | 4075aa38a80d67cbed289d53f50eec1635f117900c0911aafb8436abd0bdbd3a |
| hovercard-subject-tag | issue:488960171 |
| github-keyboard-shortcuts | repository,issues,copilot |
| google-site-verification | Apib7-x98H0j5cPqHWwSMm6dNU4GmODRoqxLiDzdx9I |
| octolytics-url | https://collector.github.com/github/collect |
| analytics-location | / |
| fb:app_id | 1401488693436528 |
| apple-itunes-app | app-id=1477376905, app-argument=https://github.com/_view_fragments/issues/show/matplotlib/matplotlib/15179/issue_layout |
| twitter:image | https://opengraph.githubassets.com/efb5454ee6c1cfec113b4d4852e79e3b9d079035776988ab186eb085d31cb4bd/matplotlib/matplotlib/issues/15179 |
| twitter:card | summary_large_image |
| og:image | https://opengraph.githubassets.com/efb5454ee6c1cfec113b4d4852e79e3b9d079035776988ab186eb085d31cb4bd/matplotlib/matplotlib/issues/15179 |
| og:image:alt | Bug report Bug summary Matplotlib patch 3.1.1 broke imshow() heatmaps. While with version 3.1.0 the heatmap was plotted correctly, in 3.1.1 the bottom most and the top most heatmap tiles are cut of... |
| og:image:width | 1200 |
| og:image:height | 600 |
| og:site_name | GitHub |
| og:type | object |
| og:author:username | svdHero |
| hostname | github.com |
| expected-hostname | github.com |
| None | eae2aab99907699a22d2c8449aa683ca74454fca87211b98f7c7b722086b2839 |
| turbo-cache-control | no-preview |
| go-import | github.com/matplotlib/matplotlib git https://github.com/matplotlib/matplotlib.git |
| octolytics-dimension-user_id | 215947 |
| octolytics-dimension-user_login | matplotlib |
| octolytics-dimension-repository_id | 1385122 |
| octolytics-dimension-repository_nwo | matplotlib/matplotlib |
| octolytics-dimension-repository_public | true |
| octolytics-dimension-repository_is_fork | false |
| octolytics-dimension-repository_network_root_id | 1385122 |
| octolytics-dimension-repository_network_root_nwo | matplotlib/matplotlib |
| turbo-body-classes | logged-out env-production page-responsive |
| disable-turbo | false |
| browser-stats-url | https://api.github.com/_private/browser/stats |
| browser-errors-url | https://api.github.com/_private/browser/errors |
| release | 6a35ab858be185cd86d12b93a43bccf34e8d8536 |
| ui-target | full |
| theme-color | #1e2327 |
| color-scheme | light dark |
Links:
Viewport: width=device-width

