Title: New yticks behavior in 3.1.1 vs 3.1.0 · Issue #14897 · matplotlib/matplotlib · GitHub
Open Graph Title: New yticks behavior in 3.1.1 vs 3.1.0 · Issue #14897 · matplotlib/matplotlib
X Title: New yticks behavior in 3.1.1 vs 3.1.0 · Issue #14897 · matplotlib/matplotlib
Description: Bug report I'm using imshow, and between 3.1.0 and 3.1.1 the behavior of the extents of the plot has changed when using Axes.set_yticks. In 3.1.0, and in 3.1.1 when not calling set_yticks, the plot includes the outer 0.5 bin in the top a...
Open Graph Description: Bug report I'm using imshow, and between 3.1.0 and 3.1.1 the behavior of the extents of the plot has changed when using Axes.set_yticks. In 3.1.0, and in 3.1.1 when not calling set_yticks, the plot...
X Description: Bug report I'm using imshow, and between 3.1.0 and 3.1.1 the behavior of the extents of the plot has changed when using Axes.set_yticks. In 3.1.0, and in 3.1.1 when not calling set_yticks, the ...
Opengraph URL: https://github.com/matplotlib/matplotlib/issues/14897
X: @github
Domain: github.com
{"@context":"https://schema.org","@type":"DiscussionForumPosting","headline":"New yticks behavior in 3.1.1 vs 3.1.0","articleBody":"### Bug report\r\nI'm using `imshow`, and between 3.1.0 and 3.1.1 the behavior of the extents of the plot has changed when using `Axes.set_yticks`. In 3.1.0, and in 3.1.1 when not calling `set_yticks`, the plot includes the outer 0.5 bin in the top and bottom rows. This is the desired behavior. But in 3.1.1 when using `set_yticks`, the outer 0.5 bin in the top and bottom rows is not included in the plot. \r\n\r\n**Code for reproduction**\r\n```python\r\nimport matplotlib\r\nimport matplotlib.pyplot as plt\r\n\r\nxy = [[1, 3], [2, 4]]\r\nfig, ax = matplotlib.pyplot.subplots(1)\r\nax.imshow(xy)\r\nax.set_xticks([0, 1])\r\nax.set_xticklabels([\"0\", \"1\"])\r\nax.set_yticks([0, 1])\r\nax.set_yticklabels([\"0\", \"1\"])\r\nfig.savefig(f\"matplotlib-v{matplotlib.__version__}.png\")\r\n```\r\nThe behavior changes in 3.1.1 if `ax.set_yticks([0, 1])` is commented out.\r\n\r\nDesired behavior\r\n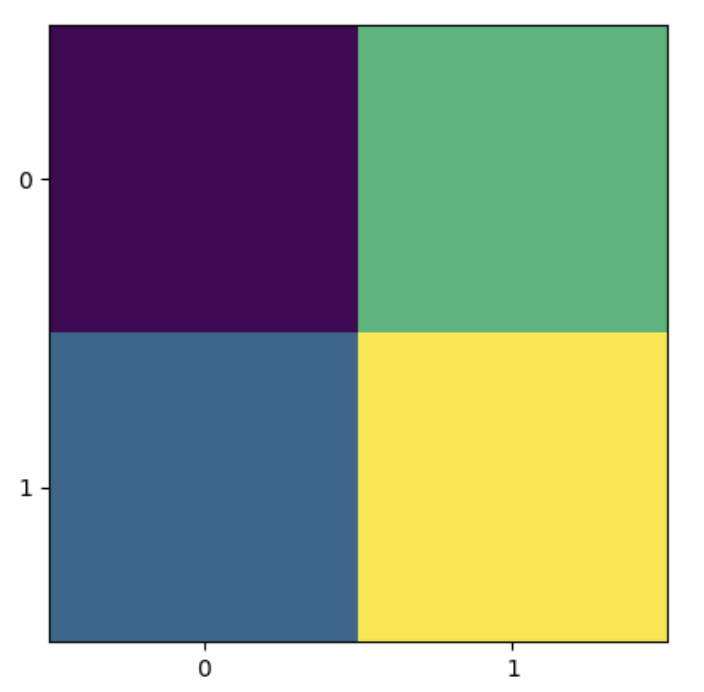\r\n\r\nBehavior in 3.1.1 with `set_yticks`\r\n\r\n\r\n**Matplotlib version**\r\n * Operating system: Mac OS 10.14.5\r\n * Matplotlib version: 3.1.1\r\n * Matplotlib backend: agg\r\n * Python version: 3.7.3\r\n * Jupyter version (if applicable): N/A\r\n * Other libraries: Fresh conda install of just matplotlib, using conda-forge","author":{"url":"https://github.com/caldwellshane","@type":"Person","name":"caldwellshane"},"datePublished":"2019-07-27T06:57:53.000Z","interactionStatistic":{"@type":"InteractionCounter","interactionType":"https://schema.org/CommentAction","userInteractionCount":2},"url":"https://github.com/14897/matplotlib/issues/14897"}| route-pattern | /_view_fragments/issues/show/:user_id/:repository/:id/issue_layout(.:format) |
| route-controller | voltron_issues_fragments |
| route-action | issue_layout |
| fetch-nonce | v2:6ca62846-8df1-efe8-a959-32f1be8920cc |
| current-catalog-service-hash | 81bb79d38c15960b92d99bca9288a9108c7a47b18f2423d0f6438c5b7bcd2114 |
| request-id | CF10:1418:4E0C693:6DBCEAE:6A571001 |
| html-safe-nonce | 977853ac03a99e413c04c16c01ff89717e54f100a28daea6acf88a96ae1e8739 |
| visitor-payload | eyJyZWZlcnJlciI6IiIsInJlcXVlc3RfaWQiOiJDRjEwOjE0MTg6NEUwQzY5Mzo2REJDRUFFOjZBNTcxMDAxIiwidmlzaXRvcl9pZCI6IjY5NTYwNTgyNzkwOTQ0NTYzMjIiLCJyZWdpb25fZWRnZSI6ImlhZCIsInJlZ2lvbl9yZW5kZXIiOiJpYWQifQ== |
| visitor-hmac | ed2f35be6b6171a09a45cbddda06a10568243f56f3352ec745788c1f118d21a2 |
| hovercard-subject-tag | issue:473607170 |
| github-keyboard-shortcuts | repository,issues,copilot |
| google-site-verification | Apib7-x98H0j5cPqHWwSMm6dNU4GmODRoqxLiDzdx9I |
| octolytics-url | https://collector.github.com/github/collect |
| analytics-location | / |
| fb:app_id | 1401488693436528 |
| apple-itunes-app | app-id=1477376905, app-argument=https://github.com/_view_fragments/issues/show/matplotlib/matplotlib/14897/issue_layout |
| twitter:image | https://opengraph.githubassets.com/0ecefb2fc674d9193552546c72efe2bb53392373ec4a3e58650aeffa5e93a913/matplotlib/matplotlib/issues/14897 |
| twitter:card | summary_large_image |
| og:image | https://opengraph.githubassets.com/0ecefb2fc674d9193552546c72efe2bb53392373ec4a3e58650aeffa5e93a913/matplotlib/matplotlib/issues/14897 |
| og:image:alt | Bug report I'm using imshow, and between 3.1.0 and 3.1.1 the behavior of the extents of the plot has changed when using Axes.set_yticks. In 3.1.0, and in 3.1.1 when not calling set_yticks, the plot... |
| og:image:width | 1200 |
| og:image:height | 600 |
| og:site_name | GitHub |
| og:type | object |
| og:author:username | caldwellshane |
| hostname | github.com |
| expected-hostname | github.com |
| None | 4e7a7296a3830877cf21a6ad2a972c9e618a48915e03966cf0c53eb08e5aad98 |
| turbo-cache-control | no-preview |
| go-import | github.com/matplotlib/matplotlib git https://github.com/matplotlib/matplotlib.git |
| octolytics-dimension-user_id | 215947 |
| octolytics-dimension-user_login | matplotlib |
| octolytics-dimension-repository_id | 1385122 |
| octolytics-dimension-repository_nwo | matplotlib/matplotlib |
| octolytics-dimension-repository_public | true |
| octolytics-dimension-repository_is_fork | false |
| octolytics-dimension-repository_network_root_id | 1385122 |
| octolytics-dimension-repository_network_root_nwo | matplotlib/matplotlib |
| turbo-body-classes | logged-out env-production page-responsive |
| disable-turbo | false |
| browser-stats-url | https://api.github.com/_private/browser/stats |
| browser-errors-url | https://api.github.com/_private/browser/errors |
| release | 2576d1f0198cf1588faf2edf27f1ed120903be10 |
| ui-target | full |
| theme-color | #1e2327 |
| color-scheme | light dark |
Links:
Viewport: width=device-width

