Title: Tick label alignment not working as described · Issue #13440 · matplotlib/matplotlib · GitHub
Open Graph Title: Tick label alignment not working as described · Issue #13440 · matplotlib/matplotlib
X Title: Tick label alignment not working as described · Issue #13440 · matplotlib/matplotlib
Description: Bug report Bug summary I want to change the horizontal alignment of the tick labels on my y-axis. This page explains a method (the one-liner on the top of the page), which does not work. Code for reproduction import matplotlib.pyplot as ...
Open Graph Description: Bug report Bug summary I want to change the horizontal alignment of the tick labels on my y-axis. This page explains a method (the one-liner on the top of the page), which does not work. Code for r...
X Description: Bug report Bug summary I want to change the horizontal alignment of the tick labels on my y-axis. This page explains a method (the one-liner on the top of the page), which does not work. Code for r...
Opengraph URL: https://github.com/matplotlib/matplotlib/issues/13440
X: @github
Domain: github.com
{"@context":"https://schema.org","@type":"DiscussionForumPosting","headline":"Tick label alignment not working as described","articleBody":"\u003c!--To help us understand and resolve your issue, please fill out the form to the best of your ability.--\u003e\r\n\u003c!--You can feel free to delete the sections that do not apply.--\u003e\r\n\r\n### Bug report\r\n\r\n**Bug summary**\r\n\r\nI want to change the horizontal alignment of the tick labels on my y-axis. [This page](https://matplotlib.org/gallery/ticks_and_spines/centered_ticklabels.html) explains a method (the one-liner on the top of the page), which does not work.\r\n\r\n**Code for reproduction**\r\n\r\n\u003c!--A minimum code snippet required to reproduce the bug.\r\nPlease make sure to minimize the number of dependencies required, and provide\r\nany necessary plotted data.\r\nAvoid using threads, as Matplotlib is (explicitly) not thread-safe.--\u003e\r\n\r\n```python\r\nimport matplotlib.pyplot as plt\r\nimport numpy as np\r\nimport matplotlib as mpl\r\nprint(\"Matplitlib version: %s\" % mpl.__version__)\r\n \r\nx = np.logspace(-2,3)\r\ny = 1 / (exp(1/x) - 1)\r\n\r\nfig = plt.figure(1, figsize=(4, 4))\r\nplt.loglog(x,y)\r\nplt.xlabel('x')\r\nplt.ylabel('y')\r\nplt.tight_layout()\r\n\r\nax = plt.gca()\r\nax.yaxis.set_tick_params(horizontalalignment='left')\r\n```\r\nThe code above is slightly longer than minimum, to motivate why I need to change the tick label alignment. The changing size of the exponent looks ugly when the labels are right-aligned.\r\n\r\n**Actual outcome**\r\n\r\n\u003c!--The output produced by the above code, which may be a screenshot, console output, etc.--\u003e\r\n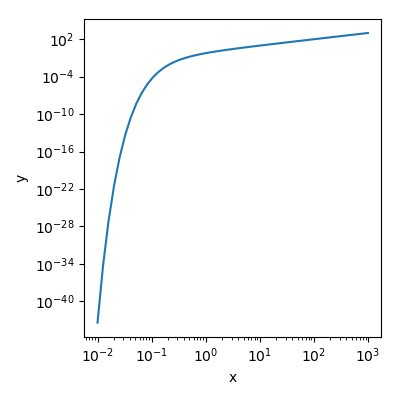\r\n\r\n```\r\nMatplitlib version: 3.0.2\r\nTraceback (most recent call last):\r\n\r\n File \"\u003cipython-input-17-ff49df94c4af\u003e\", line 1, in \u003cmodule\u003e\r\n runfile('/home/christoffer/Dropbox/Div/axislabelcentertest.py', wdir='/home/christoffer/Dropbox/Div')\r\n\r\n File \"/home/christoffer/anaconda3/lib/python3.7/site-packages/spyder_kernels/customize/spydercustomize.py\", line 668, in runfile\r\n execfile(filename, namespace)\r\n\r\n File \"/home/christoffer/anaconda3/lib/python3.7/site-packages/spyder_kernels/customize/spydercustomize.py\", line 108, in execfile\r\n exec(compile(f.read(), filename, 'exec'), namespace)\r\n\r\n File \"/home/christoffer/Dropbox/Div/axislabelcentertest.py\", line 16, in \u003cmodule\u003e\r\n ax.yaxis.set_tick_params(horizontalalignment='left')\r\n\r\n File \"/home/christoffer/anaconda3/lib/python3.7/site-packages/matplotlib/axis.py\", line 852, in set_tick_params\r\n kwtrans = self._translate_tick_kw(kw, to_init_kw=True)\r\n\r\n File \"/home/christoffer/anaconda3/lib/python3.7/site-packages/matplotlib/axis.py\", line 917, in _translate_tick_kw\r\n % (key, kwkeys))\r\n\r\nValueError: keyword horizontalalignment is not recognized; valid keywords are ['size', 'width', 'color', 'tickdir', 'pad', 'labelsize', 'labelcolor', 'zorder', 'gridOn', 'tick1On', 'tick2On', 'label1On', 'label2On', 'length', 'direction', 'left', 'bottom', 'right', 'top', 'labelleft', 'labelbottom', 'labelright', 'labeltop', 'labelrotation', 'grid_agg_filter', 'grid_alpha', 'grid_animated', 'grid_antialiased', 'grid_clip_box', 'grid_clip_on', 'grid_clip_path', 'grid_color', 'grid_contains', 'grid_dash_capstyle', 'grid_dash_joinstyle', 'grid_dashes', 'grid_drawstyle', 'grid_figure', 'grid_fillstyle', 'grid_gid', 'grid_in_layout', 'grid_label', 'grid_linestyle', 'grid_linewidth', 'grid_marker', 'grid_markeredgecolor', 'grid_markeredgewidth', 'grid_markerfacecolor', 'grid_markerfacecoloralt', 'grid_markersize', 'grid_markevery', 'grid_path_effects', 'grid_picker', 'grid_pickradius', 'grid_rasterized', 'grid_sketch_params', 'grid_snap', 'grid_solid_capstyle', 'grid_solid_joinstyle', 'grid_transform', 'grid_url', 'grid_visible', 'grid_xdata', 'grid_ydata', 'grid_zorder', 'grid_aa', 'grid_c', 'grid_ls', 'grid_lw', 'grid_mec', 'grid_mew', 'grid_mfc', 'grid_mfcalt', 'grid_ms', 'grid_aa', 'grid_c', 'grid_ls', 'grid_lw', 'grid_mec', 'grid_mew', 'grid_mfc', 'grid_mfcalt', 'grid_ms']\r\n```\r\n\r\n**Expected outcome**\r\n\r\n\u003c!--A description of the expected outcome from the code snippet--\u003e\r\n\u003c!--If this used to work in an earlier version of Matplotlib, please note the version it used to work on--\u003e\r\n\r\nI expect the alignment of the y-axis tick labels to change.\r\n\r\n**Matplotlib version**\r\n\u003c!--Please specify your platform and versions of the relevant libraries you are using:--\u003e\r\n * Operating system: Ubuntu 18.04\r\n * Matplotlib version: 3.0.2\r\n * Matplotlib backend (`print(matplotlib.get_backend())`): Qt5Agg\r\n * Python version: 3.7.1\r\n * Jupyter version (if applicable):\r\n * Other libraries: Numpy\r\n\r\n\u003c!--Please tell us how you installed matplotlib and python e.g., from source, pip, conda--\u003e\r\n\u003c!--If you installed from conda, please specify which channel you used if not the default--\u003e\r\n\r\nInstalled via conda.\r\n","author":{"url":"https://github.com/oestfeldt","@type":"Person","name":"oestfeldt"},"datePublished":"2019-02-15T09:12:41.000Z","interactionStatistic":{"@type":"InteractionCounter","interactionType":"https://schema.org/CommentAction","userInteractionCount":9},"url":"https://github.com/13440/matplotlib/issues/13440"}| route-pattern | /_view_fragments/issues/show/:user_id/:repository/:id/issue_layout(.:format) |
| route-controller | voltron_issues_fragments |
| route-action | issue_layout |
| fetch-nonce | v2:dc92d079-a62c-b103-0f23-13d090b6c685 |
| current-catalog-service-hash | 81bb79d38c15960b92d99bca9288a9108c7a47b18f2423d0f6438c5b7bcd2114 |
| request-id | ED0C:29681E:5D1100:7B2D90:6A53EE7D |
| html-safe-nonce | ccc60a8f2b6900cd459d130ac11bd30e8a474faa639c71cbe71c4d88c8a26ab8 |
| visitor-payload | eyJyZWZlcnJlciI6IiIsInJlcXVlc3RfaWQiOiJFRDBDOjI5NjgxRTo1RDExMDA6N0IyRDkwOjZBNTNFRTdEIiwidmlzaXRvcl9pZCI6IjU0MjI4MTQ2MDI5MjgwNTc5ODEiLCJyZWdpb25fZWRnZSI6ImlhZCIsInJlZ2lvbl9yZW5kZXIiOiJpYWQifQ== |
| visitor-hmac | 289dda5cd1e4f66e50125ce82ea4faacc629ce04a8b76ffe42fa51444535f9ae |
| hovercard-subject-tag | issue:410671292 |
| github-keyboard-shortcuts | repository,issues,copilot |
| google-site-verification | Apib7-x98H0j5cPqHWwSMm6dNU4GmODRoqxLiDzdx9I |
| octolytics-url | https://collector.github.com/github/collect |
| analytics-location | / |
| fb:app_id | 1401488693436528 |
| apple-itunes-app | app-id=1477376905, app-argument=https://github.com/_view_fragments/issues/show/matplotlib/matplotlib/13440/issue_layout |
| twitter:image | https://opengraph.githubassets.com/aa3369f87cb7d0e13a1b9a9ff47907206f2193e49f1c1816180c21d7bacf17f6/matplotlib/matplotlib/issues/13440 |
| twitter:card | summary_large_image |
| og:image | https://opengraph.githubassets.com/aa3369f87cb7d0e13a1b9a9ff47907206f2193e49f1c1816180c21d7bacf17f6/matplotlib/matplotlib/issues/13440 |
| og:image:alt | Bug report Bug summary I want to change the horizontal alignment of the tick labels on my y-axis. This page explains a method (the one-liner on the top of the page), which does not work. Code for r... |
| og:image:width | 1200 |
| og:image:height | 600 |
| og:site_name | GitHub |
| og:type | object |
| og:author:username | oestfeldt |
| hostname | github.com |
| expected-hostname | github.com |
| None | b9a586c06a05a7a86fc7e3f4dbd03e42f6869085879aa184aa6369456dbd50fb |
| turbo-cache-control | no-preview |
| go-import | github.com/matplotlib/matplotlib git https://github.com/matplotlib/matplotlib.git |
| octolytics-dimension-user_id | 215947 |
| octolytics-dimension-user_login | matplotlib |
| octolytics-dimension-repository_id | 1385122 |
| octolytics-dimension-repository_nwo | matplotlib/matplotlib |
| octolytics-dimension-repository_public | true |
| octolytics-dimension-repository_is_fork | false |
| octolytics-dimension-repository_network_root_id | 1385122 |
| octolytics-dimension-repository_network_root_nwo | matplotlib/matplotlib |
| turbo-body-classes | logged-out env-production page-responsive |
| disable-turbo | false |
| browser-stats-url | https://api.github.com/_private/browser/stats |
| browser-errors-url | https://api.github.com/_private/browser/errors |
| release | 07a982c1d40157c619b364352b704c3ce66bb332 |
| ui-target | full |
| theme-color | #1e2327 |
| color-scheme | light dark |
Links:
Viewport: width=device-width
