Title: Secondary axis doesn't resize properly · Issue #13417 · matplotlib/matplotlib · GitHub
Open Graph Title: Secondary axis doesn't resize properly · Issue #13417 · matplotlib/matplotlib
X Title: Secondary axis doesn't resize properly · Issue #13417 · matplotlib/matplotlib
Description: From @ImportanceOfBeingErnest I just ran the first example from this PR and the result looks like this on screen: If resizing the figure window with the mouse this can become as bad as The saved figure is fine though. (This is with maste...
Open Graph Description: From @ImportanceOfBeingErnest I just ran the first example from this PR and the result looks like this on screen: If resizing the figure window with the mouse this can become as bad as The saved fi...
X Description: From @ImportanceOfBeingErnest I just ran the first example from this PR and the result looks like this on screen: If resizing the figure window with the mouse this can become as bad as The saved fi...
Opengraph URL: https://github.com/matplotlib/matplotlib/issues/13417
X: @github
Domain: github.com
{"@context":"https://schema.org","@type":"DiscussionForumPosting","headline":"Secondary axis doesn't resize properly","articleBody":"From @ImportanceOfBeingErnest \r\n\r\nI just ran the first example from this PR and the result looks like this on screen:\r\n\r\n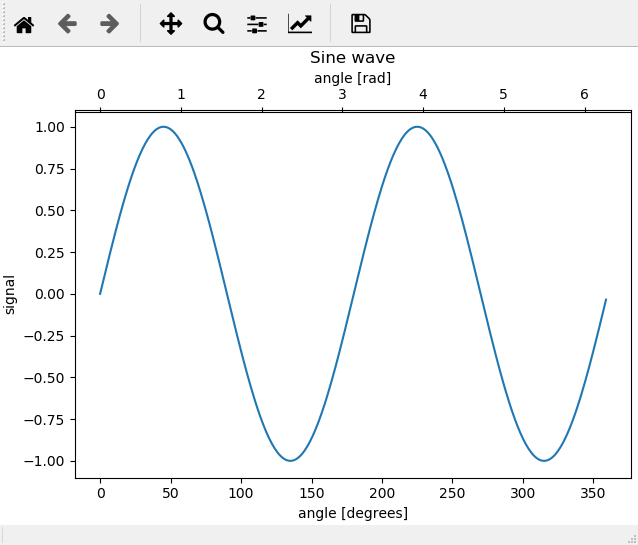\r\n\r\nIf resizing the figure window with the mouse this can become as bad as \r\n\r\n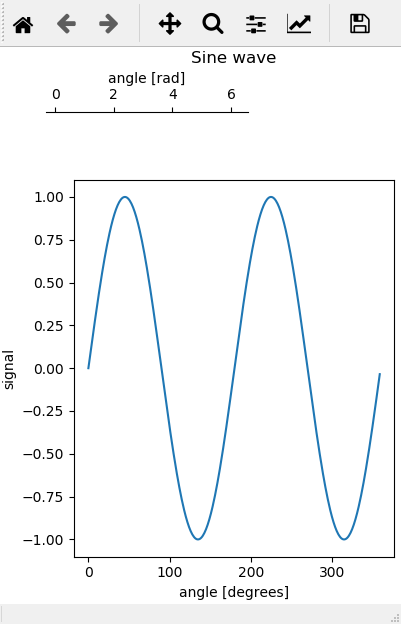\r\n\r\nThe saved figure is fine though. \r\n(This is with master fetched a few minutes ago, python 3.6.6 on windows 8.1, Qt5Agg) \r\n\r\nLet me know if you need further details or want me to test anything particular with my configuration.\r\n\r\n_Originally posted by @ImportanceOfBeingErnest in https://github.com/matplotlib/matplotlib/pull/11859#issuecomment-462596594_","author":{"url":"https://github.com/jklymak","@type":"Person","name":"jklymak"},"datePublished":"2019-02-12T03:11:49.000Z","interactionStatistic":{"@type":"InteractionCounter","interactionType":"https://schema.org/CommentAction","userInteractionCount":3},"url":"https://github.com/13417/matplotlib/issues/13417"}| route-pattern | /_view_fragments/issues/show/:user_id/:repository/:id/issue_layout(.:format) |
| route-controller | voltron_issues_fragments |
| route-action | issue_layout |
| fetch-nonce | v2:c093cfb9-2bf8-cc93-6e95-6399188ec45c |
| current-catalog-service-hash | 81bb79d38c15960b92d99bca9288a9108c7a47b18f2423d0f6438c5b7bcd2114 |
| request-id | C17A:2AB90B:10D4CC:168D44:6A52EC3D |
| html-safe-nonce | 6fdc856f25a5da545acc22585eeb1dc4da7b9354994ac2b1d7065ce6e70146c3 |
| visitor-payload | eyJyZWZlcnJlciI6IiIsInJlcXVlc3RfaWQiOiJDMTdBOjJBQjkwQjoxMEQ0Q0M6MTY4RDQ0OjZBNTJFQzNEIiwidmlzaXRvcl9pZCI6IjU0NzgzNDA1NjI5MDA5Mzc3ODkiLCJyZWdpb25fZWRnZSI6ImlhZCIsInJlZ2lvbl9yZW5kZXIiOiJpYWQifQ== |
| visitor-hmac | a14a67680275a0a6924c7265f12ecd429e013aab977ead65e7072220da06f1ce |
| hovercard-subject-tag | issue:409099813 |
| github-keyboard-shortcuts | repository,issues,copilot |
| google-site-verification | Apib7-x98H0j5cPqHWwSMm6dNU4GmODRoqxLiDzdx9I |
| octolytics-url | https://collector.github.com/github/collect |
| analytics-location | / |
| fb:app_id | 1401488693436528 |
| apple-itunes-app | app-id=1477376905, app-argument=https://github.com/_view_fragments/issues/show/matplotlib/matplotlib/13417/issue_layout |
| twitter:image | https://opengraph.githubassets.com/77f920b9e076b50af610f8d665488982726937406b3e7616dedc7ce685975bbf/matplotlib/matplotlib/issues/13417 |
| twitter:card | summary_large_image |
| og:image | https://opengraph.githubassets.com/77f920b9e076b50af610f8d665488982726937406b3e7616dedc7ce685975bbf/matplotlib/matplotlib/issues/13417 |
| og:image:alt | From @ImportanceOfBeingErnest I just ran the first example from this PR and the result looks like this on screen: If resizing the figure window with the mouse this can become as bad as The saved fi... |
| og:image:width | 1200 |
| og:image:height | 600 |
| og:site_name | GitHub |
| og:type | object |
| og:author:username | jklymak |
| hostname | github.com |
| expected-hostname | github.com |
| None | b9a586c06a05a7a86fc7e3f4dbd03e42f6869085879aa184aa6369456dbd50fb |
| turbo-cache-control | no-preview |
| go-import | github.com/matplotlib/matplotlib git https://github.com/matplotlib/matplotlib.git |
| octolytics-dimension-user_id | 215947 |
| octolytics-dimension-user_login | matplotlib |
| octolytics-dimension-repository_id | 1385122 |
| octolytics-dimension-repository_nwo | matplotlib/matplotlib |
| octolytics-dimension-repository_public | true |
| octolytics-dimension-repository_is_fork | false |
| octolytics-dimension-repository_network_root_id | 1385122 |
| octolytics-dimension-repository_network_root_nwo | matplotlib/matplotlib |
| turbo-body-classes | logged-out env-production page-responsive |
| disable-turbo | false |
| browser-stats-url | https://api.github.com/_private/browser/stats |
| browser-errors-url | https://api.github.com/_private/browser/errors |
| release | 07a982c1d40157c619b364352b704c3ce66bb332 |
| ui-target | full |
| theme-color | #1e2327 |
| color-scheme | light dark |
Links:
Viewport: width=device-width

