Title: Suggesting new feature: autolabel option for bar plots · Issue #12386 · matplotlib/matplotlib · GitHub
Open Graph Title: Suggesting new feature: autolabel option for bar plots · Issue #12386 · matplotlib/matplotlib
X Title: Suggesting new feature: autolabel option for bar plots · Issue #12386 · matplotlib/matplotlib
Description: Whenever I plot some form of bar plot I find myself thinking that it would be nice to have the bars labelled with the actual value counts (or a percentage value). Examples are given in the barplot gallery: This is the code that makes it ...
Open Graph Description: Whenever I plot some form of bar plot I find myself thinking that it would be nice to have the bars labelled with the actual value counts (or a percentage value). Examples are given in the barplot ...
X Description: Whenever I plot some form of bar plot I find myself thinking that it would be nice to have the bars labelled with the actual value counts (or a percentage value). Examples are given in the barplot ...
Opengraph URL: https://github.com/matplotlib/matplotlib/issues/12386
X: @github
Domain: github.com
{"@context":"https://schema.org","@type":"DiscussionForumPosting","headline":"Suggesting new feature: autolabel option for bar plots","articleBody":"Whenever I plot some form of bar plot I find myself thinking that it would be nice to have the bars labelled with the actual value counts (or a percentage value). Examples are given in the [barplot gallery](https://github.com/rasbt/matplotlib-gallery#boxplots-and-violinplots): \r\n\r\n\r\n\r\n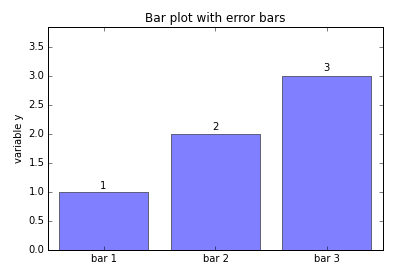\r\n\r\nThis is the code that makes it happen: \r\n\r\n``` \r\n# label bars\r\ndef autolabel(rects):\r\n for ii,rect in enumerate(rects):\r\n height = rect.get_height()\r\n plt.text(rect.get_x()+rect.get_width()/2., 1.02*height, '%s'% (mean_values[ii]),\r\n ha='center', va='bottom')\r\nautolabel(rects)\r\n```\r\n\r\nI think this feature is so crucial that it should be part of barplot via an argument such as ``autolabel = true`` or something. What do people think? Implementing this would be relatively easy I suppose but edge cases (such as error bars) might be harder to deal with. I find myself spending quite some time adjusting the heights and axis limits to make it all fit together - automating this would be a big plus. \r\n\r\n\r\n","author":{"url":"https://github.com/ebauch","@type":"Person","name":"ebauch"},"datePublished":"2018-10-03T15:30:35.000Z","interactionStatistic":{"@type":"InteractionCounter","interactionType":"https://schema.org/CommentAction","userInteractionCount":11},"url":"https://github.com/12386/matplotlib/issues/12386"}| route-pattern | /_view_fragments/issues/show/:user_id/:repository/:id/issue_layout(.:format) |
| route-controller | voltron_issues_fragments |
| route-action | issue_layout |
| fetch-nonce | v2:83f9c83d-3f39-aa0e-9990-443d9ab013a7 |
| current-catalog-service-hash | 81bb79d38c15960b92d99bca9288a9108c7a47b18f2423d0f6438c5b7bcd2114 |
| request-id | 9922:9FC62:59E518:79AAC2:6A529BCE |
| html-safe-nonce | 13daa548bc0013875a6ab456d3c3857490da36f004c2f22759b33f60998053e0 |
| visitor-payload | eyJyZWZlcnJlciI6IiIsInJlcXVlc3RfaWQiOiI5OTIyOjlGQzYyOjU5RTUxODo3OUFBQzI6NkE1MjlCQ0UiLCJ2aXNpdG9yX2lkIjoiODc2MjMwODM1MTY3OTk2MjA2MiIsInJlZ2lvbl9lZGdlIjoiaWFkIiwicmVnaW9uX3JlbmRlciI6ImlhZCJ9 |
| visitor-hmac | b0f076c8b42d756d3d5bfdb2b270ce6fd5eef8c384ef937dd0acdfc9f5065088 |
| hovercard-subject-tag | issue:366398271 |
| github-keyboard-shortcuts | repository,issues,copilot |
| google-site-verification | Apib7-x98H0j5cPqHWwSMm6dNU4GmODRoqxLiDzdx9I |
| octolytics-url | https://collector.github.com/github/collect |
| analytics-location | / |
| fb:app_id | 1401488693436528 |
| apple-itunes-app | app-id=1477376905, app-argument=https://github.com/_view_fragments/issues/show/matplotlib/matplotlib/12386/issue_layout |
| twitter:image | https://opengraph.githubassets.com/d61a909c2316aea27aec9d5b4f9d7959c07ee0ade0186b2a874c766a58f05882/matplotlib/matplotlib/issues/12386 |
| twitter:card | summary_large_image |
| og:image | https://opengraph.githubassets.com/d61a909c2316aea27aec9d5b4f9d7959c07ee0ade0186b2a874c766a58f05882/matplotlib/matplotlib/issues/12386 |
| og:image:alt | Whenever I plot some form of bar plot I find myself thinking that it would be nice to have the bars labelled with the actual value counts (or a percentage value). Examples are given in the barplot ... |
| og:image:width | 1200 |
| og:image:height | 600 |
| og:site_name | GitHub |
| og:type | object |
| og:author:username | ebauch |
| hostname | github.com |
| expected-hostname | github.com |
| None | b9a586c06a05a7a86fc7e3f4dbd03e42f6869085879aa184aa6369456dbd50fb |
| turbo-cache-control | no-preview |
| go-import | github.com/matplotlib/matplotlib git https://github.com/matplotlib/matplotlib.git |
| octolytics-dimension-user_id | 215947 |
| octolytics-dimension-user_login | matplotlib |
| octolytics-dimension-repository_id | 1385122 |
| octolytics-dimension-repository_nwo | matplotlib/matplotlib |
| octolytics-dimension-repository_public | true |
| octolytics-dimension-repository_is_fork | false |
| octolytics-dimension-repository_network_root_id | 1385122 |
| octolytics-dimension-repository_network_root_nwo | matplotlib/matplotlib |
| turbo-body-classes | logged-out env-production page-responsive |
| disable-turbo | false |
| browser-stats-url | https://api.github.com/_private/browser/stats |
| browser-errors-url | https://api.github.com/_private/browser/errors |
| release | 07a982c1d40157c619b364352b704c3ce66bb332 |
| ui-target | canary-2 |
| theme-color | #1e2327 |
| color-scheme | light dark |
Links:
Viewport: width=device-width

