Title: Faces of Axes3d.bar3d are not oriented correctly · Issue #12138 · matplotlib/matplotlib · GitHub
Open Graph Title: Faces of Axes3d.bar3d are not oriented correctly · Issue #12138 · matplotlib/matplotlib
X Title: Faces of Axes3d.bar3d are not oriented correctly · Issue #12138 · matplotlib/matplotlib
Description: All of the faces of the polygons created by bar3d are oriented (using a right-hand rule on the vertex order) in the positive axis directions. As a result, the shading used by shade=True is incorrect, as it shades both the front and back ...
Open Graph Description: All of the faces of the polygons created by bar3d are oriented (using a right-hand rule on the vertex order) in the positive axis directions. As a result, the shading used by shade=True is incorrec...
X Description: All of the faces of the polygons created by bar3d are oriented (using a right-hand rule on the vertex order) in the positive axis directions. As a result, the shading used by shade=True is incorrec...
Opengraph URL: https://github.com/matplotlib/matplotlib/issues/12138
X: @github
Domain: github.com
{"@context":"https://schema.org","@type":"DiscussionForumPosting","headline":"Faces of Axes3d.bar3d are not oriented correctly","articleBody":"All of the faces of the polygons created by `bar3d` are oriented (using a right-hand rule on the vertex order) in the positive axis directions. As a result, the shading used by `shade=True` is incorrect, as it shades both the front and back faces with the same brightness.\r\n\r\nRotating the [`hist3d`](https://matplotlib.org/examples/mplot3d/hist3d_demo.html) demo, we can see the left and right faces of the bars are the same color:\r\n\r\n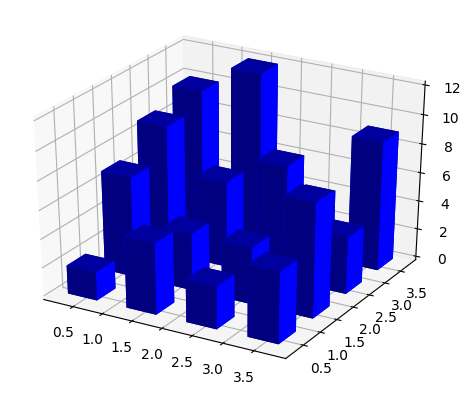\r\n\r\n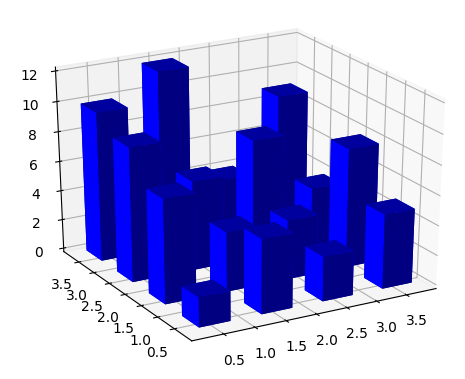\r\n\r\nThe fix is fairly straightforward, thankfully\r\n\r\n","author":{"url":"https://github.com/eric-wieser","@type":"Person","name":"eric-wieser"},"datePublished":"2018-09-17T05:21:27.000Z","interactionStatistic":{"@type":"InteractionCounter","interactionType":"https://schema.org/CommentAction","userInteractionCount":0},"url":"https://github.com/12138/matplotlib/issues/12138"}| route-pattern | /_view_fragments/issues/show/:user_id/:repository/:id/issue_layout(.:format) |
| route-controller | voltron_issues_fragments |
| route-action | issue_layout |
| fetch-nonce | v2:7dc7da21-fc33-e03b-ed51-6d9d044a08b4 |
| current-catalog-service-hash | 81bb79d38c15960b92d99bca9288a9108c7a47b18f2423d0f6438c5b7bcd2114 |
| request-id | BB90:3DC42C:362998:48F27C:6A52EBD9 |
| html-safe-nonce | 939f84900753ba7f7e9bf62e3340a2d20b141e554b7285487e47ee76badb0206 |
| visitor-payload | eyJyZWZlcnJlciI6IiIsInJlcXVlc3RfaWQiOiJCQjkwOjNEQzQyQzozNjI5OTg6NDhGMjdDOjZBNTJFQkQ5IiwidmlzaXRvcl9pZCI6IjI2MTA5NjgzMzI0OTc3NzU1NzciLCJyZWdpb25fZWRnZSI6ImlhZCIsInJlZ2lvbl9yZW5kZXIiOiJpYWQifQ== |
| visitor-hmac | db42bb46160928a8420b494fd37c257c52709d881e5e832392e053d602d20f86 |
| hovercard-subject-tag | issue:360725876 |
| github-keyboard-shortcuts | repository,issues,copilot |
| google-site-verification | Apib7-x98H0j5cPqHWwSMm6dNU4GmODRoqxLiDzdx9I |
| octolytics-url | https://collector.github.com/github/collect |
| analytics-location | / |
| fb:app_id | 1401488693436528 |
| apple-itunes-app | app-id=1477376905, app-argument=https://github.com/_view_fragments/issues/show/matplotlib/matplotlib/12138/issue_layout |
| twitter:image | https://opengraph.githubassets.com/89b73a40fd7f17a78cd2f46d5c71a3591d9760127656c49e5e1d0b8782f48e9a/matplotlib/matplotlib/issues/12138 |
| twitter:card | summary_large_image |
| og:image | https://opengraph.githubassets.com/89b73a40fd7f17a78cd2f46d5c71a3591d9760127656c49e5e1d0b8782f48e9a/matplotlib/matplotlib/issues/12138 |
| og:image:alt | All of the faces of the polygons created by bar3d are oriented (using a right-hand rule on the vertex order) in the positive axis directions. As a result, the shading used by shade=True is incorrec... |
| og:image:width | 1200 |
| og:image:height | 600 |
| og:site_name | GitHub |
| og:type | object |
| og:author:username | eric-wieser |
| hostname | github.com |
| expected-hostname | github.com |
| None | b9a586c06a05a7a86fc7e3f4dbd03e42f6869085879aa184aa6369456dbd50fb |
| turbo-cache-control | no-preview |
| go-import | github.com/matplotlib/matplotlib git https://github.com/matplotlib/matplotlib.git |
| octolytics-dimension-user_id | 215947 |
| octolytics-dimension-user_login | matplotlib |
| octolytics-dimension-repository_id | 1385122 |
| octolytics-dimension-repository_nwo | matplotlib/matplotlib |
| octolytics-dimension-repository_public | true |
| octolytics-dimension-repository_is_fork | false |
| octolytics-dimension-repository_network_root_id | 1385122 |
| octolytics-dimension-repository_network_root_nwo | matplotlib/matplotlib |
| turbo-body-classes | logged-out env-production page-responsive |
| disable-turbo | false |
| browser-stats-url | https://api.github.com/_private/browser/stats |
| browser-errors-url | https://api.github.com/_private/browser/errors |
| release | 07a982c1d40157c619b364352b704c3ce66bb332 |
| ui-target | canary-1 |
| theme-color | #1e2327 |
| color-scheme | light dark |
Links:
Viewport: width=device-width

