Title: colorbar minorticks (possibly release critical for 3.0) · Issue #12095 · matplotlib/matplotlib · GitHub
Open Graph Title: colorbar minorticks (possibly release critical for 3.0) · Issue #12095 · matplotlib/matplotlib
X Title: colorbar minorticks (possibly release critical for 3.0) · Issue #12095 · matplotlib/matplotlib
Description: Bug report Bug summary NOTE: This is only applicable for 3.0 as cbar.minorticks_on() is introduced in 3.0 only. When the minorticks are turned on for a colorbar, a minor tick is found to be missing from the vmax end of the colorbar (the ...
Open Graph Description: Bug report Bug summary NOTE: This is only applicable for 3.0 as cbar.minorticks_on() is introduced in 3.0 only. When the minorticks are turned on for a colorbar, a minor tick is found to be missing...
X Description: Bug report Bug summary NOTE: This is only applicable for 3.0 as cbar.minorticks_on() is introduced in 3.0 only. When the minorticks are turned on for a colorbar, a minor tick is found to be missing...
Opengraph URL: https://github.com/matplotlib/matplotlib/issues/12095
X: @github
Domain: github.com
{"@context":"https://schema.org","@type":"DiscussionForumPosting","headline":"colorbar minorticks (possibly release critical for 3.0)","articleBody":"\u003c!--To help us understand and resolve your issue, please fill out the form to the best of your ability.--\u003e\r\n\u003c!--You can feel free to delete the sections that do not apply.--\u003e\r\n\r\n### Bug report\r\n\r\n**Bug summary**\r\n\r\n**NOTE: This is only applicable for 3.0 as cbar.minorticks_on() is introduced in 3.0 only.**\r\n\r\nWhen the minorticks are turned on for a colorbar, a minor tick is found to be missing from the vmax end of the colorbar (the weird part is, this doesn't happen for all values of vmax).\r\n\r\n@jklymak can you please have a look?\r\n\r\n**Code for reproduction**\r\n\r\n\u003c!--A minimum code snippet required to reproduce the bug, also minimizing the number of dependencies required--\u003e\r\n\r\n```python\r\nimport numpy as np\r\nimport matplotlib.pyplot as plt\r\n\r\n# setup some generic data\r\nN = 37\r\nx, y = np.mgrid[:N, :N]\r\nZ = (np.cos(x*0.2) + np.sin(y*0.3))\r\n\r\nfig, ax= plt.subplots(figsize=(4, 3))\r\n\r\nim = ax.imshow(Z, cmap='RdBu', vmin=-1.2, vmax=1.2, interpolation='none')\r\ncbar = fig.colorbar(im, ax=ax, extend='both')\r\ncbar.minorticks_on()\r\nplt.show()\r\n```\r\n\r\n**Actual outcome**\r\n\r\n**The minor tick corresponding to the value +1.2 is missing!**\r\n\r\n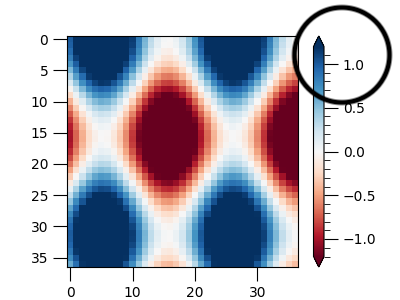\r\n\r\n\r\n\r\nEven if I increase the vmax by 10**-16 I get the same result i.e.\r\n```python\r\nim = ax.imshow(Z, cmap='RdBu', vmin=-1.2, vmax=1.2+10**-16, interpolation='none')\r\n```\r\n\r\n**Expected outcome**\r\nI get the expected outcome by increasing the vmax by 10**-15\r\n```python\r\nim = ax.imshow(Z, cmap='RdBu', vmin=-1.2, vmax=1.2+10**-15, interpolation='none')\r\n```\r\n\r\n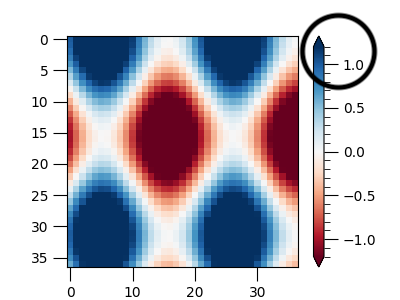\r\n\r\n\r\n**This issue doesn't show up if I use vmax=1.3**\r\n```python\r\nim = ax.imshow(Z, cmap='RdBu', vmin=-1.2, vmax=1.3, interpolation='none')\r\n```\r\n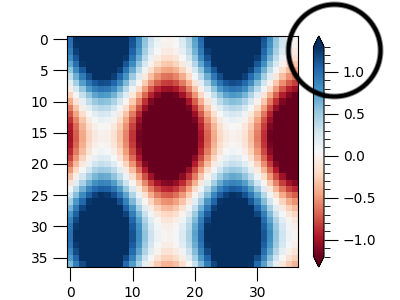\r\n\r\n\u003c!--A description of the expected outcome from the code snippet--\u003e\r\n\u003c!--If this used to work in an earlier version of Matplotlib, please note the version it used to work on--\u003e\r\n\r\n**Matplotlib version**\r\n\u003c!--Please specify your platform and versions of the relevant libraries you are using:--\u003e\r\n * Operating system: Mac OS 10.13.6\r\n * Matplotlib version: '3.0.0rc2.post25+g68845f8e5'\r\n * Matplotlib backend (`print(matplotlib.get_backend())`): Qt5Agg\r\n * Python version: Python 3.7.0\r\n\r\n\r\nP.S. I realized this when I was looking at the modification I made to https://github.com/matplotlib/matplotlib/blob/master/examples/color/colorbar_basics.py to show off cbar.minorticks_on()","author":{"url":"https://github.com/pharshalp","@type":"Person","name":"pharshalp"},"datePublished":"2018-09-11T13:45:33.000Z","interactionStatistic":{"@type":"InteractionCounter","interactionType":"https://schema.org/CommentAction","userInteractionCount":2},"url":"https://github.com/12095/matplotlib/issues/12095"}| route-pattern | /_view_fragments/issues/show/:user_id/:repository/:id/issue_layout(.:format) |
| route-controller | voltron_issues_fragments |
| route-action | issue_layout |
| fetch-nonce | v2:2fa2a81b-afc8-b4ac-24ba-26ff736080c8 |
| current-catalog-service-hash | 81bb79d38c15960b92d99bca9288a9108c7a47b18f2423d0f6438c5b7bcd2114 |
| request-id | D7C8:371D0B:4DBA5F:68640E:6A555539 |
| html-safe-nonce | 97946d849e51bad0023f24ec41434cc0c651e732efb9c8496a9fa339d32f7f11 |
| visitor-payload | eyJyZWZlcnJlciI6IiIsInJlcXVlc3RfaWQiOiJEN0M4OjM3MUQwQjo0REJBNUY6Njg2NDBFOjZBNTU1NTM5IiwidmlzaXRvcl9pZCI6Ijg1MDU0ODI5MzEwMTU2MDM1MTMiLCJyZWdpb25fZWRnZSI6ImlhZCIsInJlZ2lvbl9yZW5kZXIiOiJpYWQifQ== |
| visitor-hmac | 6107d9b437f75a8e5e5287c4cc971ed70da853b4496adbda4f24ac7dd54d018a |
| hovercard-subject-tag | issue:359054905 |
| github-keyboard-shortcuts | repository,issues,copilot |
| google-site-verification | Apib7-x98H0j5cPqHWwSMm6dNU4GmODRoqxLiDzdx9I |
| octolytics-url | https://collector.github.com/github/collect |
| analytics-location | / |
| fb:app_id | 1401488693436528 |
| apple-itunes-app | app-id=1477376905, app-argument=https://github.com/_view_fragments/issues/show/matplotlib/matplotlib/12095/issue_layout |
| twitter:image | https://opengraph.githubassets.com/8bbf80136ce859b3c56e556537983c614a46447ea2db96b2d388dfcd018f3db0/matplotlib/matplotlib/issues/12095 |
| twitter:card | summary_large_image |
| og:image | https://opengraph.githubassets.com/8bbf80136ce859b3c56e556537983c614a46447ea2db96b2d388dfcd018f3db0/matplotlib/matplotlib/issues/12095 |
| og:image:alt | Bug report Bug summary NOTE: This is only applicable for 3.0 as cbar.minorticks_on() is introduced in 3.0 only. When the minorticks are turned on for a colorbar, a minor tick is found to be missing... |
| og:image:width | 1200 |
| og:image:height | 600 |
| og:site_name | GitHub |
| og:type | object |
| og:author:username | pharshalp |
| hostname | github.com |
| expected-hostname | github.com |
| None | b5665c84831ed9ac4fb79519c16c9c5580ba8092fb8bb6e3e72972ec7197348e |
| turbo-cache-control | no-preview |
| go-import | github.com/matplotlib/matplotlib git https://github.com/matplotlib/matplotlib.git |
| octolytics-dimension-user_id | 215947 |
| octolytics-dimension-user_login | matplotlib |
| octolytics-dimension-repository_id | 1385122 |
| octolytics-dimension-repository_nwo | matplotlib/matplotlib |
| octolytics-dimension-repository_public | true |
| octolytics-dimension-repository_is_fork | false |
| octolytics-dimension-repository_network_root_id | 1385122 |
| octolytics-dimension-repository_network_root_nwo | matplotlib/matplotlib |
| turbo-body-classes | logged-out env-production page-responsive |
| disable-turbo | false |
| browser-stats-url | https://api.github.com/_private/browser/stats |
| browser-errors-url | https://api.github.com/_private/browser/errors |
| release | 73595e82546ca2415571a2031890ab16ecb3001a |
| ui-target | full |
| theme-color | #1e2327 |
| color-scheme | light dark |
Links:
Viewport: width=device-width


