Title: Savefig's frameon is ignored · Issue #10939 · matplotlib/matplotlib · GitHub
Open Graph Title: Savefig's frameon is ignored · Issue #10939 · matplotlib/matplotlib
X Title: Savefig's frameon is ignored · Issue #10939 · matplotlib/matplotlib
Description: The savefig documentation says about the frameon argument frameon : bool If True, the figure patch will be colored, if False, the figure background will be transparent. If not provided, the rcParam ‘savefig.frameon’ will be used. This do...
Open Graph Description: The savefig documentation says about the frameon argument frameon : bool If True, the figure patch will be colored, if False, the figure background will be transparent. If not provided, the rcParam...
X Description: The savefig documentation says about the frameon argument frameon : bool If True, the figure patch will be colored, if False, the figure background will be transparent. If not provided, the rcParam...
Opengraph URL: https://github.com/matplotlib/matplotlib/issues/10939
X: @github
Domain: github.com
{"@context":"https://schema.org","@type":"DiscussionForumPosting","headline":"Savefig's frameon is ignored","articleBody":"The `savefig` documentation says about the `frameon` argument \r\n\u003eframeon : bool \r\n\u003eIf True, the figure patch will be colored, if False, the figure background will be transparent. If not provided, the rcParam ‘savefig.frameon’ will be used.\r\n\r\nThis does not seem to be the case\r\n\r\n\r\n fig, ax = plt.subplots(figsize = (3,3), dpi=72)\r\n ax.set_facecolor(\"navajowhite\")\r\n fig.savefig(\"fname\", framon=True) # or False\r\n\r\ngives (grey is the background to see the effect):\r\n\r\n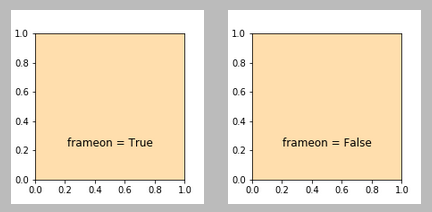\r\n\r\nWe would expect to see a difference if `frameon=False`, namely to not have the white frame present in the plot. \r\n\r\nThe only option to get the frame off is apparently to use a transparent color for the `facecolor` argument\r\n```\r\nfig.savefig(\"fname\", facecolor=(1,1,1,0))\r\n```\r\n\r\n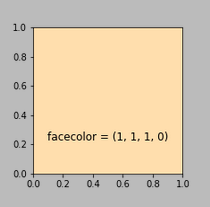\r\n\r\nThis however still keeps the background patch. It is hence what we would expect the `transparent` argument in `savefig` to do.\r\n\r\n\u003etransparent : bool \r\n\u003eIf True, the axes patches will all be transparent; the figure patch will also be transparent unless facecolor and/or edgecolor are specified via kwargs. This is useful, for example, for displaying a plot on top of a colored background on a web page.\r\n\r\nSo this has essentially the effect one would expect from `frameon`, except that it applies to the figure patch **and** the axes patches. \r\n\r\n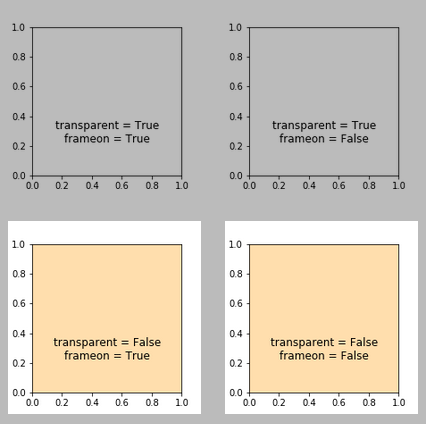\r\n\r\nIt also is overwritten in case a `facecolor` is specified.\r\n\r\n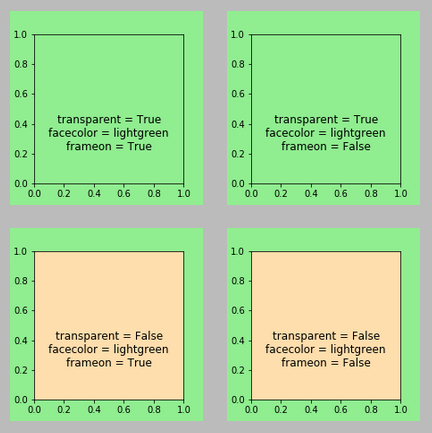\r\n\r\nWhile this is according to the documentation, it's highly confusing. \r\n\r\nHere is a jupyter notebook in case people want to reproduce all the figures: [TransparencyIssue.zip](https://github.com/matplotlib/matplotlib/files/1866618/TransparencyIssue.zip)\r\n\r\n\r\n\r\n\r\nTo summarize:\r\n* `frameon` is ignored. \r\n* There is hence no way to completely get rid of the background frame (only to make it transparent).\r\n* The `transparent` is conditional on the `facecolor` being set. (This leads to very counterintuitive behaviour, e.g. `savefig(..., transparent=True, facecolor=None)` results in a **non-transparent** background with a transparent axes.\r\n\r\nProposal for a fix:\r\n\r\n* `frameon` keeps or removes the background patch.\r\n* `transparent` turns the background patch and all axes transparent, independently of the facecolor.\r\n* `facecolor` with a transparent color like `(1,1,1,0)` can be used in the rather uncommon case where a transparent background patch is needed (and hence `frameon=False` would not help) but the axes should not be made transparent.\r\n* (optional) Check if it makes sense to let `transparent=True` remove a colorbar patch's facecolor [[*](https://stackoverflow.com/questions/53190203/matplotlib-pyplot-pcolor-savefig-colorbar-transparency)]\r\n\r\n\r\n","author":{"url":"https://github.com/ImportanceOfBeingErnest","@type":"Person","name":"ImportanceOfBeingErnest"},"datePublished":"2018-04-01T19:13:32.000Z","interactionStatistic":{"@type":"InteractionCounter","interactionType":"https://schema.org/CommentAction","userInteractionCount":4},"url":"https://github.com/10939/matplotlib/issues/10939"}| route-pattern | /_view_fragments/issues/show/:user_id/:repository/:id/issue_layout(.:format) |
| route-controller | voltron_issues_fragments |
| route-action | issue_layout |
| fetch-nonce | v2:6dd27a77-4b80-39d7-895f-7a78bbaefb1b |
| current-catalog-service-hash | 81bb79d38c15960b92d99bca9288a9108c7a47b18f2423d0f6438c5b7bcd2114 |
| request-id | EC0A:134698:A18EF4:DBCC87:6A5203B8 |
| html-safe-nonce | 1954a8a75173d61b1e6a7495d113b1a66fd0eb2289a578481319850c26cd5e0f |
| visitor-payload | eyJyZWZlcnJlciI6IiIsInJlcXVlc3RfaWQiOiJFQzBBOjEzNDY5ODpBMThFRjQ6REJDQzg3OjZBNTIwM0I4IiwidmlzaXRvcl9pZCI6IjE4Mjk1ODE1NjA3ODcxMDg3OTIiLCJyZWdpb25fZWRnZSI6ImlhZCIsInJlZ2lvbl9yZW5kZXIiOiJpYWQifQ== |
| visitor-hmac | 4d72526a3828f18c192503d5645e0f6948c1bff706e8ec5d94ff74604f2df49c |
| hovercard-subject-tag | issue:310346473 |
| github-keyboard-shortcuts | repository,issues,copilot |
| google-site-verification | Apib7-x98H0j5cPqHWwSMm6dNU4GmODRoqxLiDzdx9I |
| octolytics-url | https://collector.github.com/github/collect |
| analytics-location | / |
| fb:app_id | 1401488693436528 |
| apple-itunes-app | app-id=1477376905, app-argument=https://github.com/_view_fragments/issues/show/matplotlib/matplotlib/10939/issue_layout |
| twitter:image | https://opengraph.githubassets.com/0c2ddc11d276c13c42d3040fa38ad865b36189dee1e7f1628410870c9af210a0/matplotlib/matplotlib/issues/10939 |
| twitter:card | summary_large_image |
| og:image | https://opengraph.githubassets.com/0c2ddc11d276c13c42d3040fa38ad865b36189dee1e7f1628410870c9af210a0/matplotlib/matplotlib/issues/10939 |
| og:image:alt | The savefig documentation says about the frameon argument frameon : bool If True, the figure patch will be colored, if False, the figure background will be transparent. If not provided, the rcParam... |
| og:image:width | 1200 |
| og:image:height | 600 |
| og:site_name | GitHub |
| og:type | object |
| og:author:username | ImportanceOfBeingErnest |
| hostname | github.com |
| expected-hostname | github.com |
| None | b9a586c06a05a7a86fc7e3f4dbd03e42f6869085879aa184aa6369456dbd50fb |
| turbo-cache-control | no-preview |
| go-import | github.com/matplotlib/matplotlib git https://github.com/matplotlib/matplotlib.git |
| octolytics-dimension-user_id | 215947 |
| octolytics-dimension-user_login | matplotlib |
| octolytics-dimension-repository_id | 1385122 |
| octolytics-dimension-repository_nwo | matplotlib/matplotlib |
| octolytics-dimension-repository_public | true |
| octolytics-dimension-repository_is_fork | false |
| octolytics-dimension-repository_network_root_id | 1385122 |
| octolytics-dimension-repository_network_root_nwo | matplotlib/matplotlib |
| turbo-body-classes | logged-out env-production page-responsive |
| disable-turbo | false |
| browser-stats-url | https://api.github.com/_private/browser/stats |
| browser-errors-url | https://api.github.com/_private/browser/errors |
| release | 7aed05249554b889eb33d002851a973eebcc7e91 |
| ui-target | full |
| theme-color | #1e2327 |
| color-scheme | light dark |
Links:
Viewport: width=device-width


